Relevance
Newest
Oldest
Insights
-

Featured
2024 Annual Marketing Report
Discover how global marketers are allocating budgets, maximizing ROI and what these trends mean for your own impact…
Marketing performance2m read
-
 Webinar
Navigating AI in Marketing Mix Modeling: Risk and Rewards
Are you ready to explore the transformative power of Artificial Intelligence in revolutionizing marketing measurement and…
Marketing performance3m read
-
 Article
Peaks and valleys: Ad spending trends around the world
Competitive advertising intelligence data is often overlooked in media planning. But these insights are invaluable to…
Advertising4m read
-
 Article
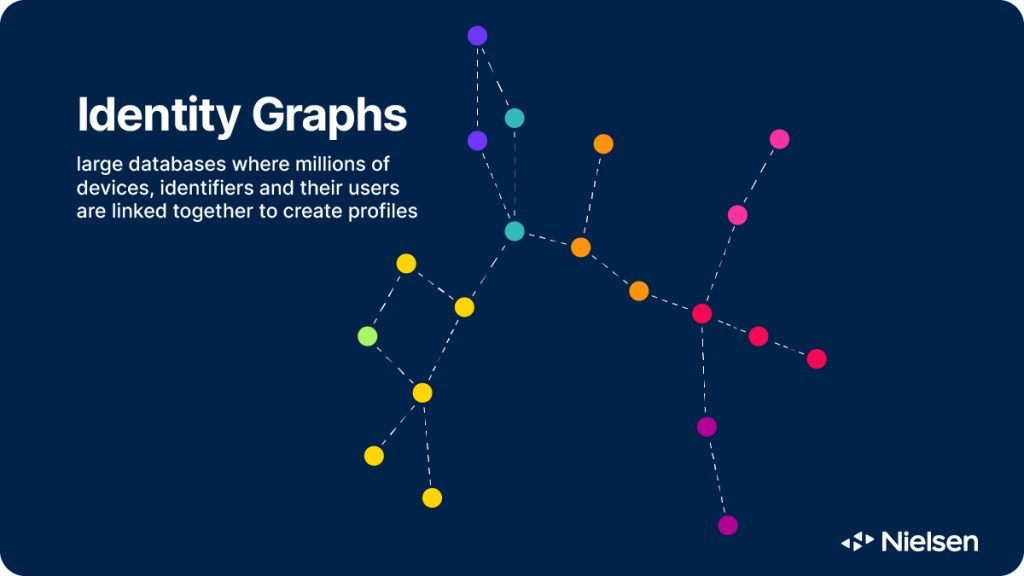
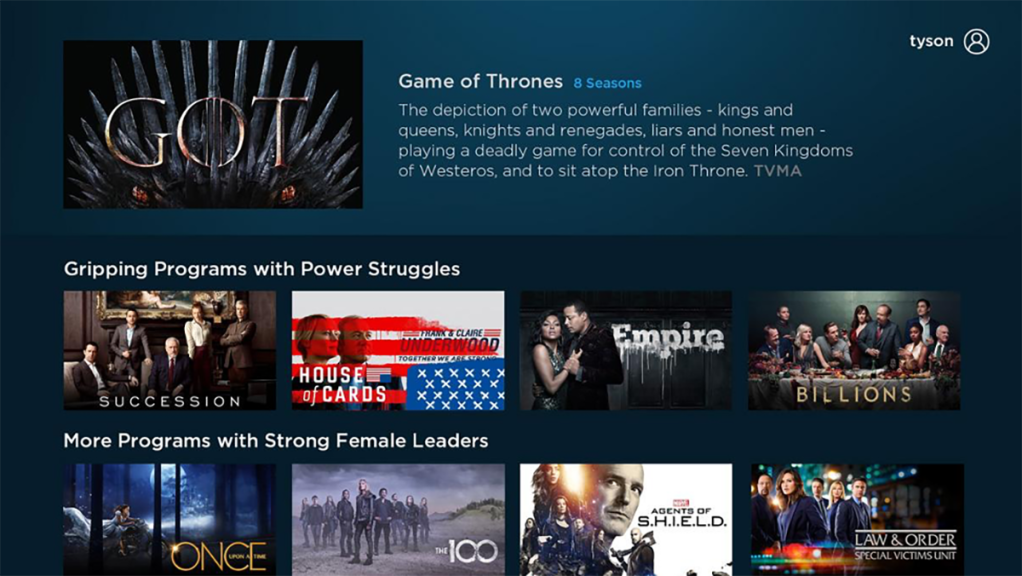
Need to Know: What’s an identity graph and why do marketers need them?
For consistent, comprehensive and comparable audience measurement across platforms, marketers need a robust ID system…
Marketing performance7m read
-
Featured
Navigating AI in Marketing Mix Modeling: Risk and Rewards
Are you ready to explore the transformative power of Artificial Intelligence in revolutionizing marketing measurement and…
Marketing performance3m read
Featured reports
-
Report
2024 Annual Marketing Report
Discover how global marketers are allocating budgets, maximizing ROI and what these trends mean for your own impact…
Marketing performance2m read
-
 Report
Metadata matters: Powering future FAST channel success
This guide will help FAST channels prepare for the future, when search and discovery features within individual services…
TV & streaming1m read
-
 Report
The global Black audience: Shaping the future of media
Black America continues to diversify, and media will need to evolve to stay relevant for this media-hungry audience with…
Audiences5m read
