The most elusive and valuable of all media measurement is an independent, reliable understanding of the people who consumed a piece of content – whether it be video, audio or text.
There are a host of amazing analytics technologies and platforms that help publishers, media planners and advertisers measure the number of devices that view their content. However, the ability to provide an accurate view of how many actual people those viewing and readership metrics represent – is rare.
This is an important distinction. According to PWC and IAB New Zealand, $589 million of advertiser budgets were invested in the digital space in 2014 – an increase of 25%. Mobile ad expenditure at this stage only represents $12 million of this, but has increased 218% on the previous year.
While this kind of shift makes it perfectly natural to reconsider your own ad investment decisions– the story of consumer behaviour is vastly different to what traffic metrics reveal.
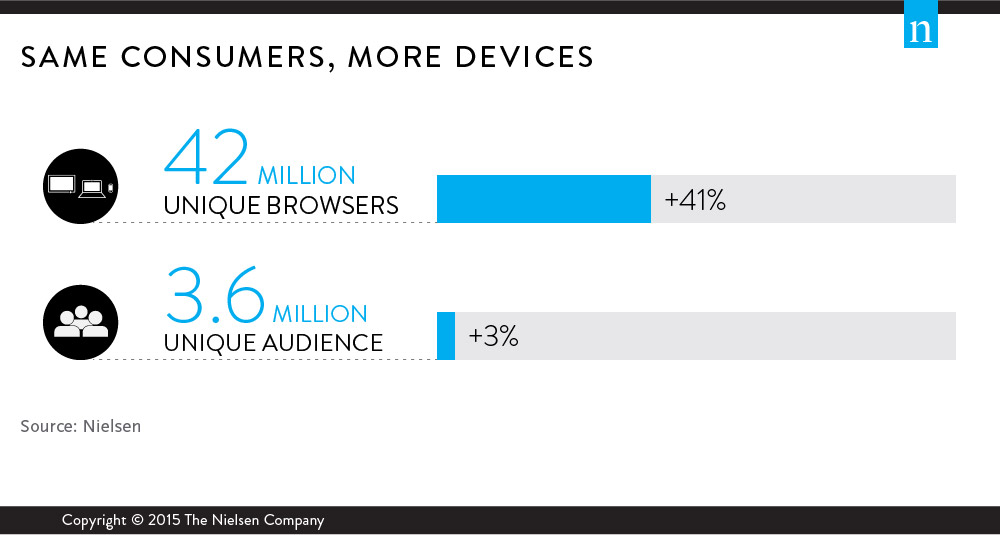
The shift in spend is certainly in line with device measurement and analytics. The total number of unique browsers accessing digital content from within New Zealand grew by 41% in the year to June 2015. This figure is 34% when looking at the average daily unique browsers metric. This is not from a replacement or substitution of desktops and laptops; it’s driven by the addition of smartphones to the consumers’ media consumption repertoire. Session counts from desktops and laptops was stable during this period (down by 1%) while sessions from mobile phones increased by 106% and tablets by 53%. Total audiences to digital content however remained relatively stable, with only a 3% shift in the total number of New Zealanders online over the 12 months to June 2015.
Analytics tools serve an important purpose in helping content owners, media agencies and advertisers understand how digital content is consumed by screens and devices in New Zealand. But you need to understand how people behind those screens and devices behave, and what content they consume when investing in advertising dollars.