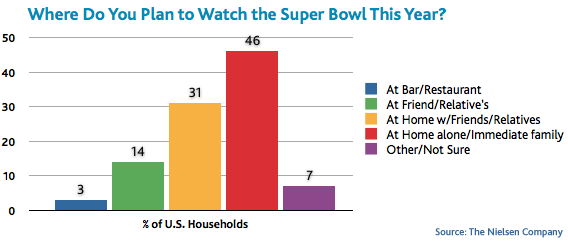
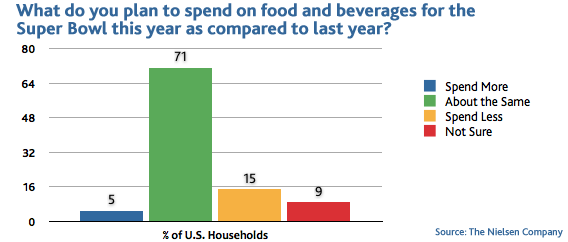
The great majority of U.S. households (9 out of 10) say they will be watching Super Bowl XLIV at home or at a friend’s or relative’s house instead of watching it from a restaurant or bar, according to a new survey by The Nielsen Company. And for their home viewing, only five percent of households expect to spend more on food and beverages for the Super Bowl this year.
“Staying in is the new ‘night out’ and we see this trend continue to play out with the Super Bowl,” said Nick Lake, vice president, group client director, Beverage Alcohol at Nielsen. “Consumers continue to rein in spending and while this ‘new normal’ provides challenges for restaurant and bar owners, it presents opportunities for consumer packaged goods (CPG) retailers and manufacturers.”

Nielsen’s survey of more than 28,000 U.S. households also shows that 86 percent of Super Bowl viewers plan to spend the same amount or less on food and beverages for the Super Bowl this year, while only five percent plan to spend more.

Beer and The Big Game
While beer and football are popular American pastimes, the Super Bowl, somewhat surprisingly, is not the most popular beer holiday. Nielsen’s research shows that the Super Bowl ranks relatively low among holiday beer sales, after the Fourth of July, Memorial Day, Labor Day and Halloween.
| Beer Sales | |
|---|---|
| Event | 2 Week Case Sales (millions of units) |
| 4th of July | 63.5 |
| Memorial Day | 61.0 |
| Labor Day | 60.2 |
| Thanksgiving | 52.8 |
| Christmas | 52.8 |
| Halloween | 50.7 |
| Super Bowl | 49.2 |
| Source: The Nielsen Company |
“We see the lowest amount of beer sales during the first quarter of the year leading up to a peak in the summer,” said Lake. “However, the Super Bowl continues to be a bigger and bigger event where consumers drink billions of servings of beer servings at home. Beer marketers are taking advantage of that opportunity to drive sales during what is typically a slower period for beer purchases.”
Grocery the Big Winner
Nielsen’s analysis shows that with the exception of late March, grocery retailers experienced the biggest weeks for Q1 beer sales during the two weeks surrounding Super Bowl 2009, with nearly 17 million cases sold.
“At-home viewing of the Super Bowl is predominantly more of an opportunity for grocery stores, rather than other CPG retailers,” said Lake. “Today’s consumers want value but also want convenience. While picking up snacks and soda, they’re adding beer to their grocery baskets. In the week leading up to the Super Bowl, look for heavy promotions at grocery stores, encouraging consumers to take advantage of the one-stop-shop for their Super Bowl party needs.”
No Kickoff Without Snacks
Super Bowl viewers across the country stock their at-home parties with snacks, nearly 166 million pounds of snacks, especially salty snacks. Potato chips reign, with more than 44 million pounds of snacks sold while tortilla chips and pretzels also rank high for Super Bowl sales. The Super Bowl snack with the greatest growth? Popped popcorn!
| Dollar Sales (in millions) | Equivalized Unit Volume (millions, 16 ounce basis) |
EQ % Change YOY | |
|---|---|---|---|
| TOTAL SNACKS | $644.70 | 165.9 | -3.3 |
| SNACKS – POTATO CHIPS | $173.80 | 44.3 | 1.2 |
| SNACKS – TORTILLA CHIPS | $135.90 | 39.1 | -2.8 |
| POPCORN – UNPOPPED | $39.30 | 15.8 | -12.2 |
| SNACKS – PRETZEL | $38.70 | 13.1 | 3.2 |
| SNACKS – PUFFED CHEESE | $36.80 | 8.9 | 2.4 |
| SNACKS – CORN CHIPS | $22.40 | 6.1 | -8.1 |
| POPCORN – POPPED | $8.50 | 1.8 | 32.3 |
| TOTAL CRACKERS | $185.00 | 56.4 | -4.0 |
| TOTAL NUTS | $108.50 | 23.8 | -12.2 |
Private Label Snacks Gaining Ground
Consumers in the ‘”new normal” are trying private label or store brand items more than ever before and this trend holds true for snack items with private label snacks gaining ground. For example, during the two weeks surrounding the Super Bowl in 2007, private label snacks held a dollar share of 6.8 and an equivalized share of 10.4. During the two weeks surrounding the Super Bowl in 2009, this jumped to a dollar share of 8.1 and an equivalized share of 12.5. Similar trends are evident for private label crackers, nuts and frozen pizza.


