Relevance
Newest
Oldest
Insights
-
Featured
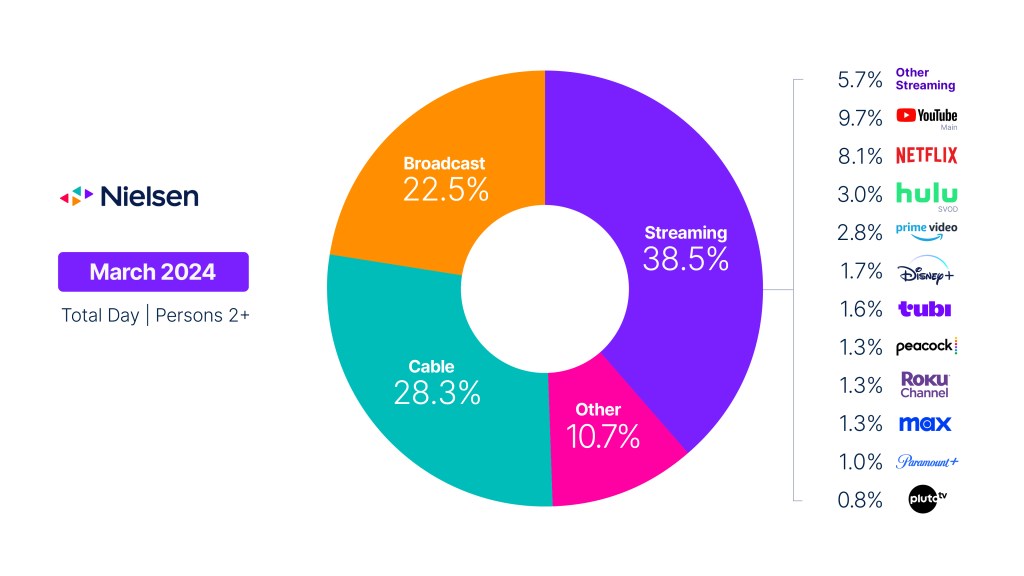
College basketball boosts U.S. cable viewing in March
Following seasonal viewing trends that typically begin in February, overall television usage in the U.S. dipped again in…
TV & streaming5m read
-
 Article
Metadata is the key to compelling fan experiences as sports migrate to streaming
Sports, unlike all other genres, have the power to attract large, consistent TV viewership—and on set schedules….
TV & streaming4m read
-
Article
College basketball boosts U.S. cable viewing in March
Following seasonal viewing trends that typically begin in February, overall television usage in the U.S. dipped again in…
TV & streaming5m read
-
 Article
What’s TV these days?
Linear and streaming TV experiences are converging, and it could be a best case scenario for the entire media industry.
Advertising4m read
-
Featured
Metadata is the key to compelling fan experiences as sports migrate to streaming
Sports, unlike all other genres, have the power to attract large, consistent TV viewership—and on set schedules….
TV & streaming4m read
Featured reports
-
 Report
Metadata matters: Powering future FAST channel success
This guide will help FAST channels prepare for the future, when search and discovery features within individual services…
TV & streaming1m read
-
 Report
The global Black audience: Shaping the future of media
Black America continues to diversify, and media will need to evolve to stay relevant for this media-hungry audience with…
Audiences5m read
-
 Report
The Upfronts/NewFronts Guide 2024
Discover the data and insights you need to navigate a shifting media landscape with Nielsen’s 2024-25 Upfronts/NewFronts…
Advertising18m read
