Demographics and buying behavior are critical for any company to understand consumer preferences and demand. But consumer purchasing data can also help nonprofit organizations looking to better understand, serve and reach their populations of interest.
Special Olympics International (SOI), the world’s largest sports organization for people with intellectual disabilities*, is one such organization, and it recently turned to Nielsen to gain insights that it hopes will help heighten awareness and understanding of people with intellectual disabilities.
SOI serves 4.5 million athletes every day across 170 countries through sports competitions and programming including public health and youth activation programs. According to the organization, about 6.5 million people in the U.S. and as many 200 million people worldwide have an intellectual disability, and little data currently exists on them, including their consumer preferences and habits.
In October 2014, Nielsen entered into a strategic alliance with SOI, through which SOI named Nielsen as its preferred market research and insights provider. As part of this alliance, Nielsen is helping SOI gain a deeper understanding of its athletes and the attitudes of the general population using data, measurement and analytics capabilities through a joint collaboration between three areas within Nielsen: Nielsen Cares, Public Development and Sustainability and the ADEPT Employee Resource Group.
To provide SOI with insight into the purchases of U.S. households with intellectual disabilities, Nielsen used its Homescan consumer panel. To build the group of consumers, Nielsen added questions about the Special Olympics and intellectual disabilities to the March and April 2015 Panel Views Online Omnibus Survey. The survey is fielded to rotating halves of the Homescan panel at the beginning of each month; each “half” is demographically and geographically representative of the total panel in the U.S. Almost 50,000 households responded to the Special Olympics questions during these two months.
The Nielsen Consumer and Shopper Analytics team found that 5.5% of U.S. households have a member with intellectual disabilities, representing $31 billion in buying power annually. The team also found that 7.1% additional households have an immediate family member (parent or child) with intellectual disabilities who lives outside the household, and they have $35 billion in buying power. Combined, this group has $66 billion in collective annual buying power, indicating that it’s a robust and important group in the U.S. consumer market.
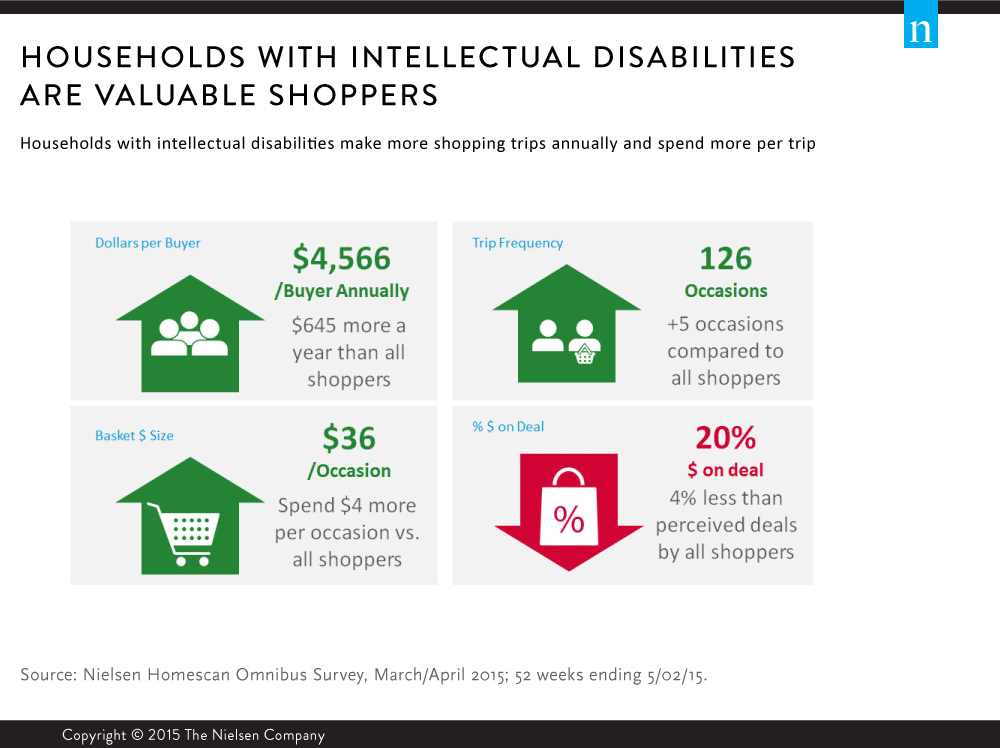
Looking closer at the 5.5% of households with a member with intellectual disabilities, Nielsen found that they are particularly valuable shoppers—spending more and making more shopping trips annually than the U.S. average of all shoppers. They also spend less on products they perceive to be on deal or promotion. In the 52 weeks ending May 2, 2015, households with intellectual disabilities spent an average of $4,566 across all shopping outlets on UPC-coded items—$645 more than the average of all households. Households with intellectual disabilities also made 126 shopping trips during the year, spending $36 on UPC-coded items per occasion, and both of these figures are larger than those of the total household average.
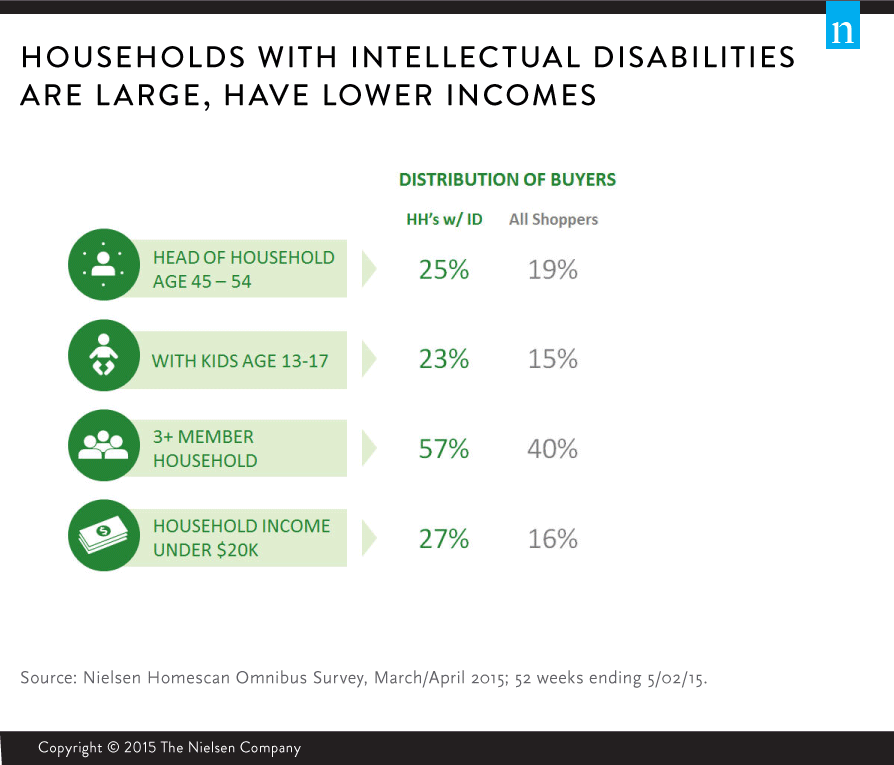
Demographically, households with intellectual disabilities are larger than average and have older kids (ages 13 to 17). They have lower incomes than the average, 25% have a head of household aged 45 to 54 years old and 57% have three or more household members.
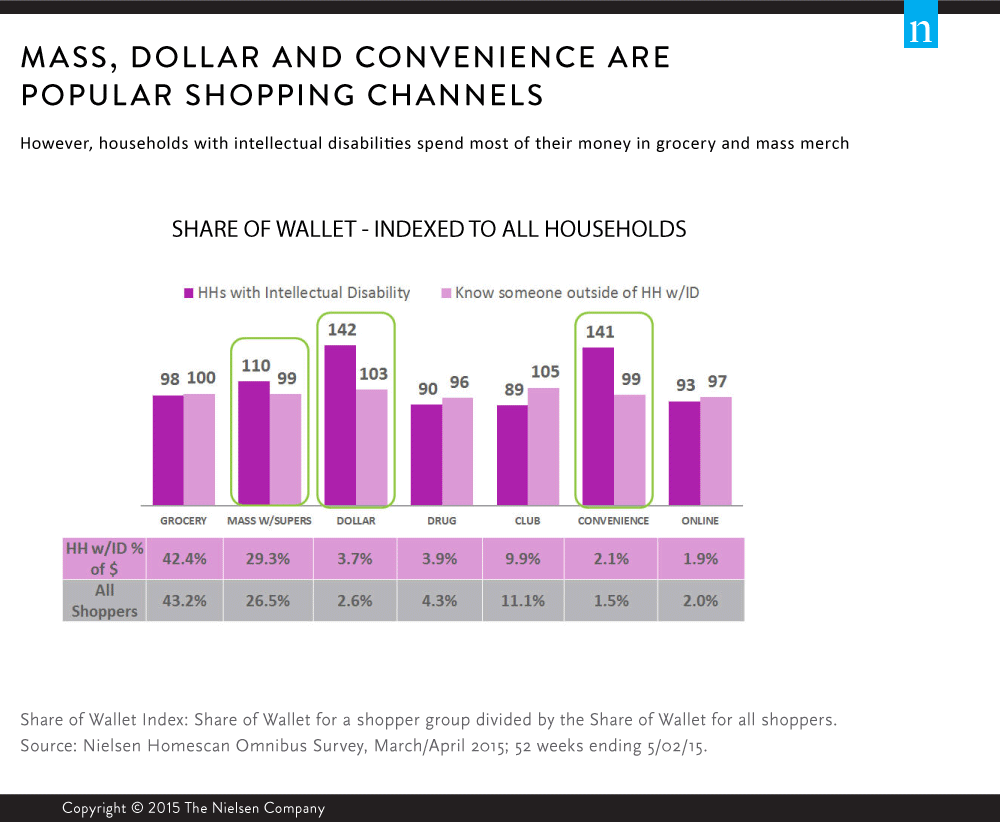
The Nielsen team also looked at the channels where households with intellectual disabilities spend their money. Households with intellectual disabilities spent a relatively greater share of their wallet in the dollar, convenience and mass merchandise with supermarkets buying channels. During the study period, the team found that they also visited dollar and convenience stores more frequently than all shoppers (17 vs. 13 visits in the year for dollar, and 15 vs. 11 visits in the year for convenience). At grocery stores, where households spend the most money, households with intellectual disabilities spent an average of $1,977 during the year, compared with $1,721 for all shoppers. Households with intellectual disabilities spent relatively less of their wallet share in grocery, drug, club and online channels than all shoppers.
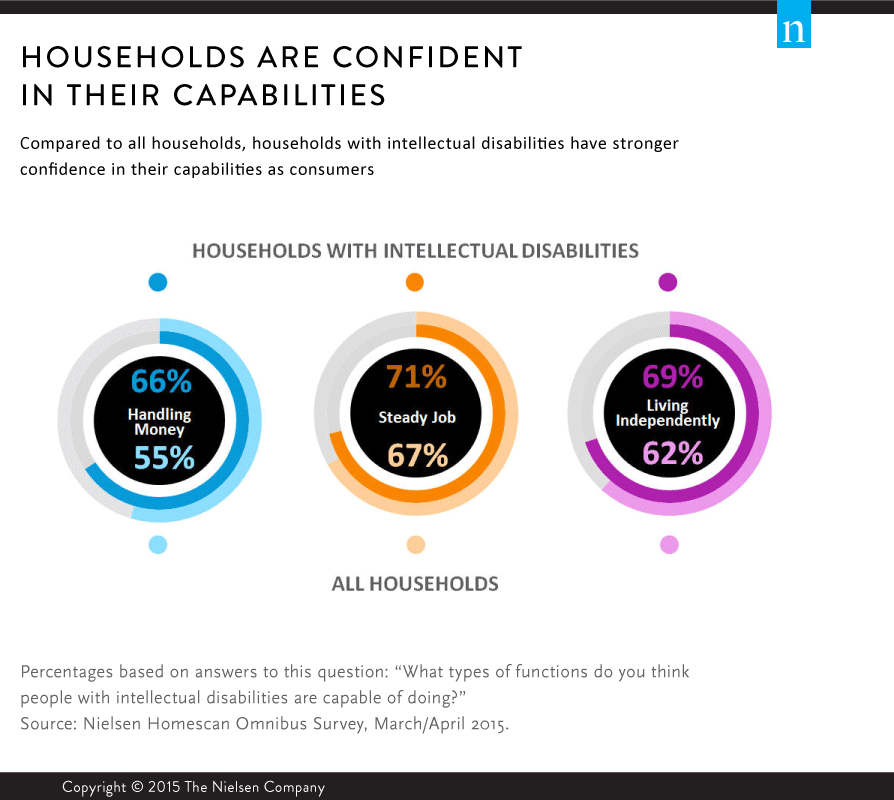
Finally, and importantly, households with intellectual disabilities are more confident in their capabilities as consumers than the aggregate group of households studied. For example, when asked, “What types of functions do you think people with intellectual disabilities are capable of doing?”, 66% of these households answered that people with intellectual disabilities are capable of handling money; 71% think they can hold a steady job; and 69% think they can live independently—all larger shares than the perceptions of all households.
Ahead of the 2015 Special Olympics World Games Opening Ceremony in Los Angeles later this week and the 25th anniversary of the Americans with Disabilities Act, SOI now has data about the scope and power of people with intellectual disabilities. By using this data, along with other insights Nielsen is providing to them, SOI will be better equipped to advance its mission of helping every person with intellectual disabilities be their best and healthiest, as well as reduce stigmas and change attitudes toward people with intellectual disabilities.
*Special Olympics defines the term “intellectual disability” to describe a person with certain limitations in cognitive functioning and other skills, including communication and self-care.
Harris Poll also recently conducted a survey on the state of Americans’ attitudes on intellectual disabilities for the Shriver Report and Special Olympics. Findings were released on July 24, 2015.