Seasonality plays a role in an overall television usage decline of 3% during the month
Following seasonal viewing trends that typically begin in February, overall television usage in the U.S. dipped again in March. Despite declines across categories, cable and streaming saw their share of TV viewing increase in this month’s report of The GaugeTM as a result of smaller declines in viewing in these categories compared with the overall decline of 3% on a monthly basis. While these changes follow similar month-over-month trends from last year, they also point at larger shifts happening to Americans’ media habits.
The growing influence of women’s sports
Similar to March 2023, the NCAA “March Madness” tournament helped cable viewing hold steady and gain 0.7 share point, as the category saw a 43% bump in sports viewing, to finish the month with 28.3% of TV. However, unlike last year, which was driven almost exclusively by the men’s division, the NCAA women’s games charged onto TV screens this March.
In fact, the NCAA Women’s Basketball matchup between the Iowa Hawkeyes and the West Virginia Mountaineers on March 25 on ESPN was among the top 10 cable telecasts for the month (seventh overall). The comparable game last year barely made it into the top 100 among cable telecasts. And this didn’t include the Elite Eight, Final Four and Championship games, which took place in April.
The appeal of the tournament among sports fans highlights the impact that high-demand content has on viewership, regardless of platform or channel, and also highlights a larger trend we’re seeing in the rise of women’s sports.
Seasonality or changing media habits?
Beyond March Madness, TV’s February-to-March changes in 2024 are almost identical to the transition we saw last year, reflecting seasonality in viewing as a result of annual changes in weather, vacations, holidays etc. However, we can see evidence of larger transformations affecting the industry as we look deeper into the data.
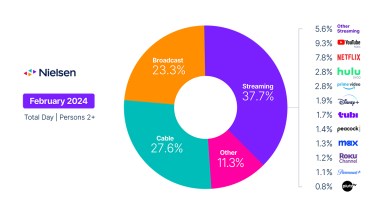
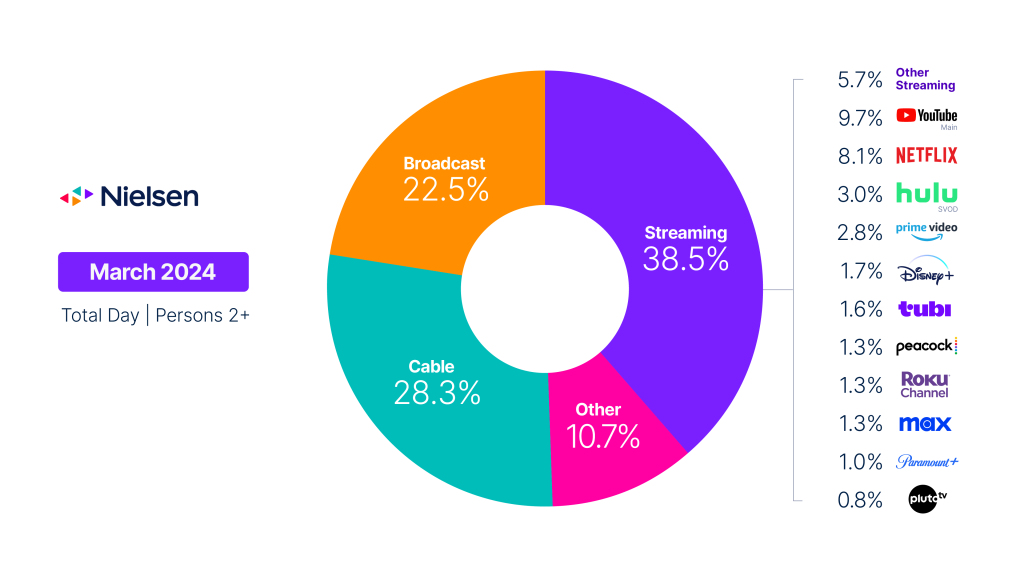
Following seasonal trends similar to the past few years, broadcast viewing fell 6% in March to finish with a 22.5% share of television. To add some perspective, when Nielsen released the first edition of the GaugeTM in May 2021, the broadcast category accounted for 25% of television viewing, and despite the continued declines, the category has been fairly resilient, with a less sharp drop than some might have expected.
Comparatively, streaming viewing declined just 1% versus last month but gained 0.8 share points to finish with 38.5% of television viewing in March. No category has seen a more dramatic shift than streaming on an annual basis, as it’s gained 12% versus a year ago and added 4.4 share points. Some of that shift has come from FAST channel providers (PlutoTV, The Roku Channel and TubiTV), with a considerable portion of the titles being fueled by cable network content.
So while the cable category may be shrinking in terms of its share of television, cable content remains powerful with consumers. In addition to March Madness, the State of The Union address on March 7, which drew 32.2 million viewers in total (14.1 million on cable alone), reminds us that cable remains a news-driven category as six of the top 10 cable telecasts this month were related to the event. As we look toward November, cable will play a significant role in how audiences connect with news media ahead of the 2024 U.S. elections.
March data trends with Brian Fuhrer
Methodology and frequently asked questions
How is ‘The Gauge’ created?
The data for The Gauge is derived from two separately weighted panels and combined to create the graphic. Nielsen’s streaming data is derived from a subset of Streaming Meter-enabled TV households within the National TV panel. The linear TV sources (broadcast and cable), as well as total usage are based on viewing from Nielsen’s overall TV panel.
All the data is time period based for each viewing source. The data, representing a broadcast month, is based on Live+7 viewing for the reporting interval (Note: Live+7 includes live television viewing plus viewing up to seven days later for linear content).
What is included in “other”?
Within The Gauge, “other” includes all other TV usage that does not fall into the broadcast, cable or streaming categories. This primarily includes all other tuning (unmeasured sources), unmeasured video on demand (VOD), audio streaming, gaming and other device (DVD playback) use.
Beginning with the May 2023 interval, Nielsen began utilizing Streaming Content Ratings to identify original content distributed by platforms reported in that service to reclassify content viewed via cable set top boxes. This viewing will credit to streaming and to the streaming platform which distributed it. It will also be removed from the other category, where it was previously reflected. Content not identified as original within Streaming Content Ratings and viewed through a cable set top box will still be included in other.
What is included in “other streaming”?
Streaming platforms listed as “other streaming” includes any high-bandwidth video streaming on television that is not individually broken out. Apps designed to deliver live broadcast and cable (linear) programming (vMVPD or MVPD applications like Sling TV or Charter/Spectrum) are excluded from “other streaming.”
Where does linear streaming contribute?
Linear streaming (as defined by the aggregation of viewing to vMVPD/MVPD apps) is excluded from the streaming category as the broadcast and cable content viewed through these apps credits to its respective category. This methodological change was implemented with the February 2023 interval.
What about live streaming on Hulu and YouTube?
Linear streaming via vMVPD apps (e.g., Hulu Live, YouTube TV) are excluded from the streaming category. ‘Hulu SVOD’ and ‘YouTube Main’ within the streaming category refer to the platforms’ usage without the inclusion of linear streaming.