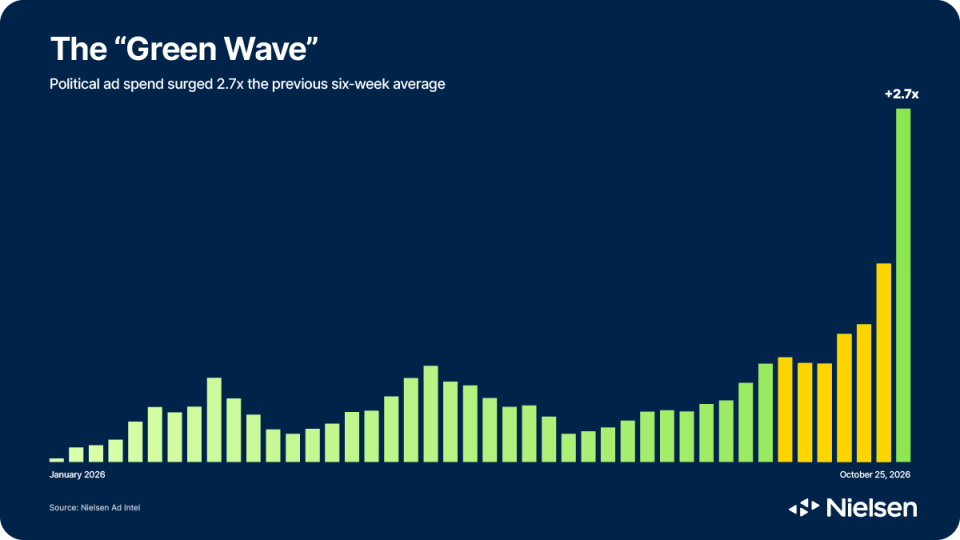
31.2 million people tuned in during primetime coverage of midterm results,the most-watched midterm election night since 2018 per Nielsen. Before the votes were counted, Nielsen AdIntel followed a distinct “green wave” where ad spending swept key battleground markets.
In the final week ahead of the election, political TV ad spend surged 2.9x higher than the previous six-week average. This influx surpassed the 1.6x increase seen in the political ad spend landscape ahead of the 2024 general election. 1
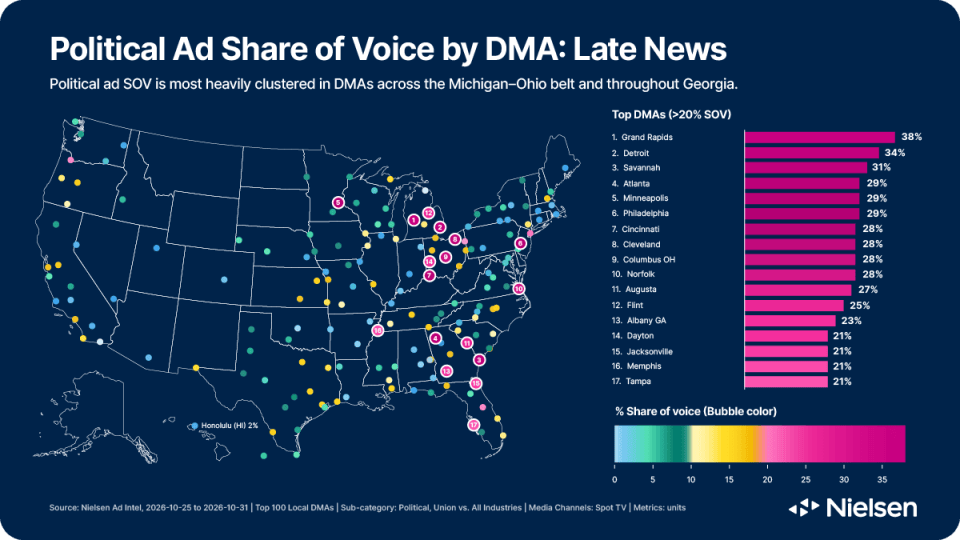
While many races made national headlines, it is often local media that carries the message to voters. 70% of U.S. marketers consider Linear TV an effective channel, and political campaigns got the memo. Local TV delivered at least 50% of political ad impressions this election cycle. In fact, nearly two out of every five ads in Grand Rapids, MI were related to campaigns in the week leading up to the election. But zooming in on the Late News daypart, political ads made up nearly three of every four spots for Grand Rapids viewers. Michigan was hardly an isolated case; more than 11 local TV markets saw political messaging account for at least 20% of total broadcast ad inventory in the final week of midterm election season.
For political campaigns, saturating the screen requires walking a fine line between persuasion and overexposure. Nielsen’s latest Annual Marketing Report found that 41% of U.S. consumers consider all video content to be “TV,” regardless of delivery channel. With linear and connected screens blending together in the consumer’s mind, top Connected TV political advertisers actively combated fatigue by diversifying their creative rotations. Instead of consolidating around a single high-reach message, the top 50 CTV political spenders, including some of the most successful campaigns, expanded their creative pool week after week, more than tripling their average ad variations from three in mid-September to 11 by late October.5
As the political buying spree recedes, brand leaders have a prime window to reclaim share of voice across key broadcast and streaming channels. But stepping back into these environments requires nuance: audiences are just beginning to recover from weeks of heavy political ad saturation. To avoid triggering viewer fatigue, advertisers must actively manage frequency and deploy dynamic creative variations that keep messaging fresh.
At the same time, post-election news coverage will dominate screens for weeks to come. Brands can evaluate competitive presence in news programming through Nielsen Ad Intel to identify whitespace, while measuring cross-channel deduplicated reach and frequency with Nielsen ONE Ads to ensure their post-election campaigns hit performance goals without over-saturating recovering audiences.
Notes
1 Nielsen AdIntel, 2026-01-01 to 2026-10-31 & 2024-01-01 to 2024-11-02 | National & All Local Markets | Sub-category: Political, Union | Media Channels: Digital Display, Digital Social, Digital Video, CTV, Streaming, Cable TV, Network Clearance Spot TV, Network TV, Spanish Language Cable TV, Spanish Language Network TV Spot TV, Syndicated Clearance Spot TV
2 Nielsen Annual Marketing Survey, Top 3 Box, 2026
3 Nielsen Ad Intel, 2026-01-01 to 2026-10-31 | National & All Local Markets | Sub-category: Political, Union | Media Channels: Network Clearance Spot TV, Spot TV, Syndicated Clearance Spot TV | Preliminary data
4 Nielsen Ad Intel, 2026-10-25 to 2026-10-31 | All Local DMAs | Sub-category: Political, Union vs. All | Media Channels: Spot TV | Metrics: units
5 Nielsen AdIntel, 2026-09-13 to 2026-10-31 | National | Sub-category: Political, Union | Media Channels: CTV | Parents: Top 50 advertisers by spend