As the new college basketball season tips off this week, fan engagement across the country continues to grow. Following a blockbuster year where men’s college basketball viewership surged by +20% and women’s college basketball jumped +19%, Nielsen has released its inaugural Nielsen Scarborough Local College Basketball Fandom Index. This comprehensive benchmark identifies America’s Top 20 most avid college basketball markets for both men’s and women’s programs.
Rather than relying solely on traditional television ratings, Nielsen leveraged its proprietary data across seven multidimensional fan touchpoints: apparel purchases, live event attendance, digital streaming, social media engagement, television viewership, radio listening, and overall interest level. The result is a data-driven blueprint revealing where fandom runs deepest and how fan behavior varies across different Nielsen markets.
The Powerhouse Top Markets
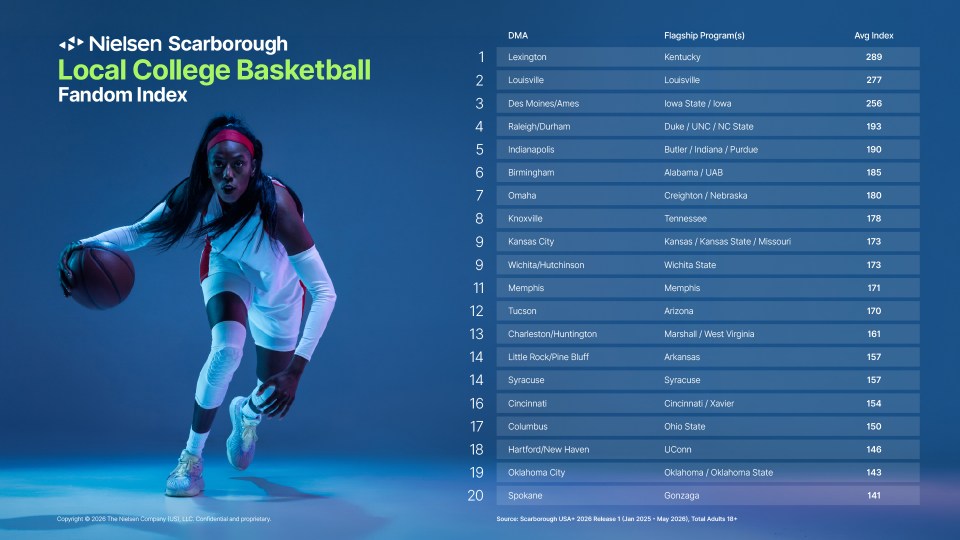
At the apex of the index sits the basketball-crazed state of Kentucky. Lexington claims the #1 position nationwide with an index score of 289, followed closely by Louisville at #2 with a score of 277. Both Designated Market Areas (DMAs) demonstrate dominant engagement across every single metric—from live game attendance to TV and radio broadcasts to digital streaming and merchandise.
Rounding out the top five are Des Moines/Ames (#3, 256), powered by fervent support for Iowa and Iowa State; Raleigh/Durham (#4, 193), home to the famous Tobacco Road rivalries of Duke, UNC, and NC State; and Indianapolis (#5, 190), driven by Butler, Indiana and Purdue.
Other key regional hubs making the Top 20 include Birmingham (#6, 185), Omaha (#7, 180), Knoxville (#8, 178), Kansas City (#9, 173), and Syracuse (#15, 157), demonstrating that mid-tier Southeast and Midwest markets frequently outperform larger metropolitan areas in concentrated passion.
Decoding Regional Fan Behaviors: Key Marketing Takeaways
For brand marketers, advertisers, and media planners, the Fandom Index underscores that high fan interest manifests differently depending on the market:
- Unified Cross-Channel Campaigns in Kentucky: Lexington and Louisville lead nationally across TV, streaming, radio, and live events. Brands running omni-channel campaigns will find maximum synergy and reach in these top two cities.
- Apparel Sales Outpace TV Viewership in Select Hubs: Traditional TV ratings don’t tell the whole story. Columbus (#17, 150) ranks #1 nationally for team apparel purchases despite lower viewing numbers. Similarly, Omaha ranks #2 in gear sales with minimal advertising noise. In these markets, e-commerce and retail promotions deliver higher conversions than broadly broadcast ad spots.
- Digital & Radio Powerhouses: Des Moines/Ames stands out as a digital media leader, topping social media, streaming, and radio engagement. Connected TV (CTV) and digital audio campaigns are exceptionally effective in capturing these highly interactive fans before they make purchasing decisions.
- Tech-Savvy Experience Seekers: In tech-heavy regions like Raleigh/Durham, fans show a strong preference for live event attendance and streaming platforms over standard linear TV, making experiential marketing and OTT streaming integrations prime targets.
- Passion Beats Population in the Southeast: Smaller markets such as Birmingham and Knoxville generate higher merchandise sales than massive media hubs like Atlanta, proving that deep local affinity often generates higher marketing ROI than sheer audience size.
The Bottom Line
Nielsen’s Local College Basketball Fandom Index proves that college basketball enthusiasm is a multi-platform phenomenon. As viewership continues its rapid upward trajectory across both men’s and women’s games, understanding these distinct regional nuances will empower brands and media networks to craft smarter, higher-impact campaigns throughout the season.