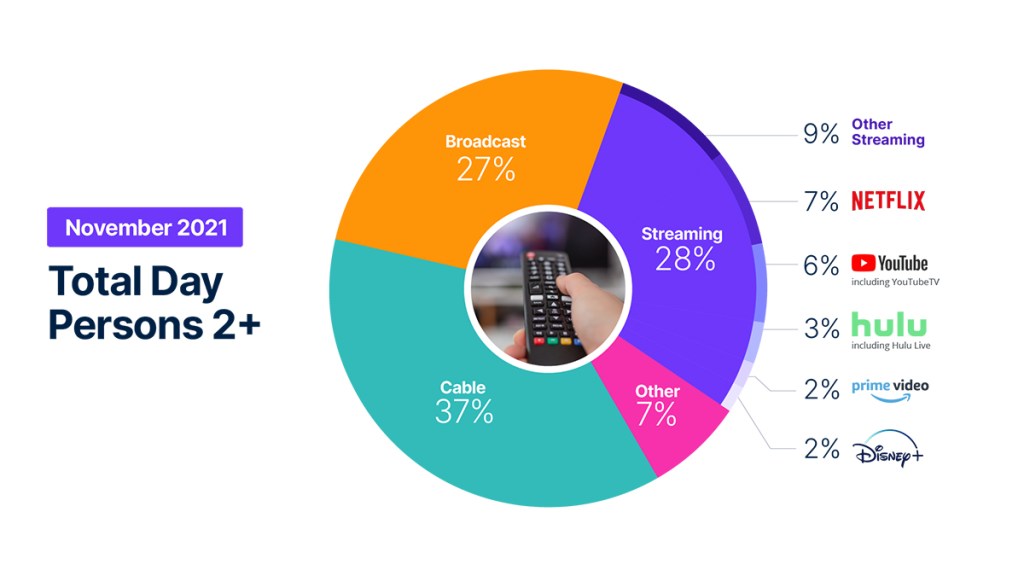
番組のリリース、スポーツのシーズン、さらには天候など、テレビの利用状況に影響を与えるさまざまな要因があるなかで、最も基本的なもののひとつである「休暇」と同じ効果をもたらすものはほとんどない。ニールセンのTVとストリーミングの総合スナップショットであるThe Gaugeよると、感謝祭の休暇と日常から離れた時間が消費者を刺激し、11月は毎週5%多くの時間をTVに費やした。
11月のテレビ利用は全体的に増加したものの、潮の満ち引きがすべての船を均等に持ち上げたわけではない。特筆すべきは、学校が休みになったことで、ビデオゲーム(「その他」のカテゴリーに含まれ、シェアポイントを獲得)やディズニー+のコンテンツ視聴に費やす時間が増えたことである。
テレビの総使用量に関して、11月には主に3つの変化があった:
- 放送テレビは、一般ドラマ(12%減)とシットコム(7%減)の視聴減により、シェアポイントを落とした。
- スポーツ視聴は好調を維持し、ワールドシリーズがなくても視聴率は7%上昇した。
- 長編映画に対する季節的な欲求が同部門を12%増加させた。イブニング・アニメーション部門は、2本の長寿作品が牽引し、今月大きく動いた:グリンチ」と「赤鼻のトナカイ」である。
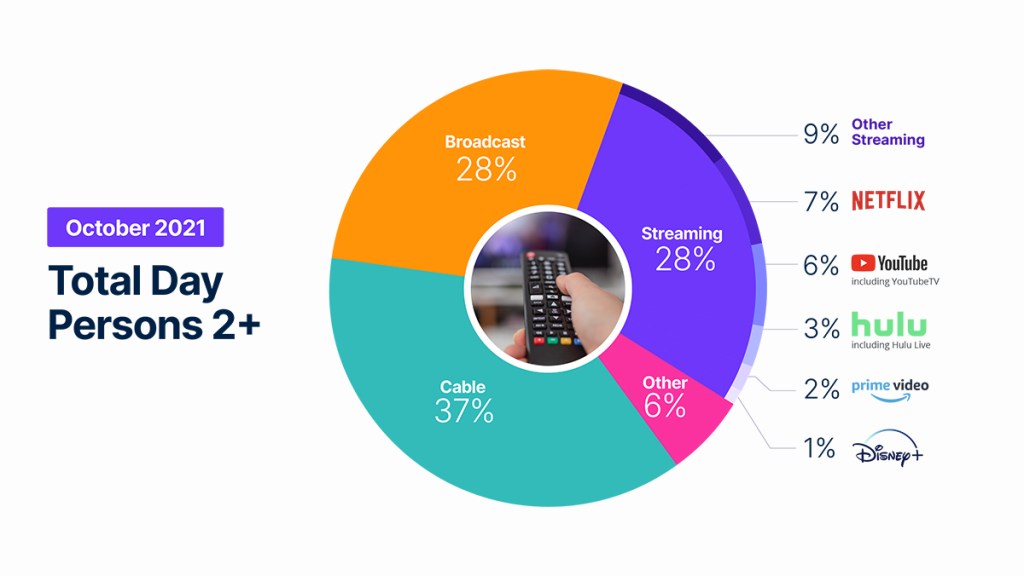
ストリーミング配信者の中で、Disney+は、視聴時間が20%近く増加し、総視聴数のパーセンテージポイントを回復したため、視聴数が報告された唯一のプラットフォームであった。増加の主な要因は2つあり、1つはこのプラットフォームの主要視聴者(子供)の追加視聴可能時間、もう1つはDisney+の日に公開された「シャンチー」と「ジャングルクルーズ」である。これとは別に、Amazonプライム・ビデオの総シェアは2%と横ばいであったが、同プラットフォームの総視聴時間は10月と比較して8%増加した。


ニールセンの製品戦略担当SVPであるブライアン・フーラーが、The Gauge支える視聴の変化の舞台裏を紹介するビデオをご覧ください。
方法論とよくある質問
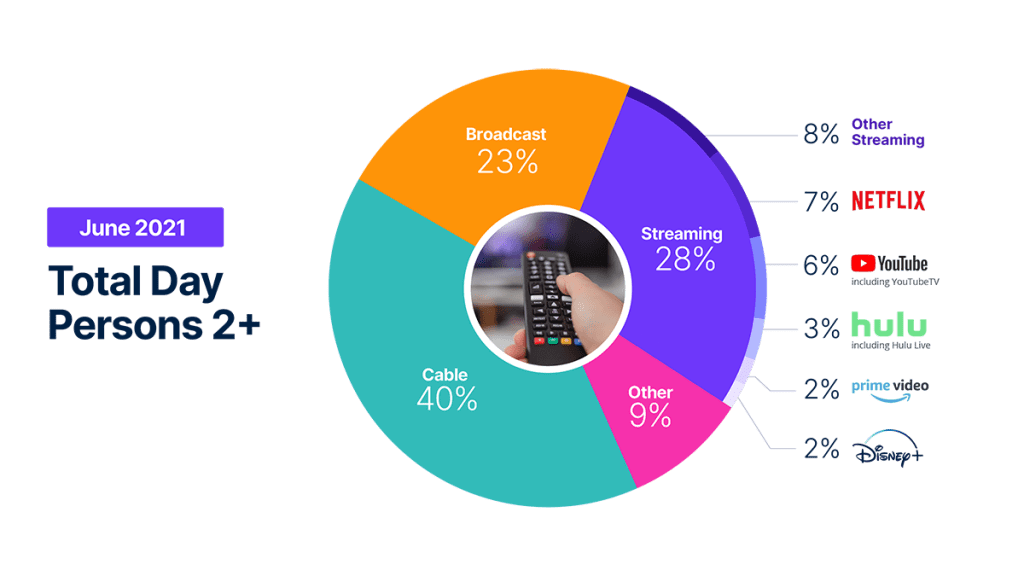
The Gauge 、放送、ストリーミング、ケーブル、その他のソースを含む主要なテレビ配信プラットフォームにおいて、消費者がどのようにコンテンツにアクセスしているかを月次でマクロ分析したものである。また、主要な個別ストリーミング配信事業者の内訳も掲載している。チャート自体は、各ストリーミング配信事業者のカテゴリー別シェアとテレビ利用全体のシェアを示している。
The Gauge」はどのようにして作られるのか?
The Gauge データは、2つのパネルから別々に加重平均されたものであり、それを組み合わせてグラフを作成している。ニールセンのストリーミングデータは、全米TVパネル内のStreaming Meter対応TV世帯のサブセットに基づいている。リニアTVソース(放送とケーブル)と総使用量は、ニールセンのTVパネル全体の視聴に基づいている。
すべてのデータは、各視聴ソースの特定の期間に基づいている。5週間の月を表すデータには、データ期間の1週目から4週目までのLive+7と、5週目のLive+3の組み合わせが含まれる。(注:Live+7は、テレビのライブ視聴と7日後までの視聴を含む。ライブ+3は、テレビ視聴+3日後までの視聴を含む)。
その他」には何が含まれるのか?
The Gauge「その他」には、その他すべてのテレビが含まれる。これには主に、その他のチューニング(未測定ソース)、未測定のビデオ・オン・デマンド(VOD)、ケーブル・セット・トップ・ボックス経由のストリーミング、ゲーム、その他のデバイス(DVD再生)の利用が含まれる。ケーブルセットトップボックス経由のストリーミング」は、各ストリーミング配信事業者をクレジットしていないため、「その他」に含まれる。ケーブルセットトップボックス経由のストリーミングでは、各ストリーミング配信事業者をクレジットしていないため、これらは「その他」のカテゴリーに含まれる。
その他のストリーミング」には何が含まれますか?
その他のストリーミング」として記載されているストリーミングプラットフォームには、個別に区分されていないテレビでの広帯域ビデオストリーミングが含まれる。
HuluやYouTubeでのライブストリーミングも含まれますか?
はい、HuluにはHulu Liveでの視聴が含まれ、YoutubeにはYoutube TVでの視聴が含まれます。
エンコードされたライブTV、別名エンコードされたリニアストリーミングは、放送とケーブルの両グループ(リニアTV)に含まれるほか、ストリーミングとその他のストリーミング(Hulu Live、Youtube TV、その他のストリーミングMVPD/vMVPDアプリなど)にも含まれる。(注:MVPD(Multichannel Video Programming Distributor)は、複数のテレビチャンネルを提供するサービス。vMVPDは、主要な番組ネットワークからライセンスを受けたリニア(テレビ)コンテンツを集約し、スタンドアロンのサブスクリプション形式でパッケージ化し、ブロードバンド接続のあるデバイスからアクセスできるようにした配信事業者である)