Streaming TV
Top 10
Original, acquired, and movie viewing
Discover the top streaming programs in the U.S., including the most-watched streaming originals, movies and acquired titles. Ranked by total minutes viewed by persons 2+.



Oct. 26 – Nov. 01, 2026
| Program Name | Rank | Minutes (Millions) | # of Episodes | Streaming Provider(s) |
|---|---|---|---|---|
| From |
1
|
2,043 | 30 | Netflix |
| Grey's Anatomy |
2
|
889 | 470 | Hulu | Netflix |
| Nobody Wants This |
3
|
847 | 30 | Netflix |
| Love Is Blind |
4
|
796 796 | 147 | Netflix |
| The Big Bang Theory |
5
|
781 781 | 279 | HBO Max |
| The Terminal List |
6
|
779 779 | 16 | Prime Video |
| Bluey |
7
|
754 754 | 154 | Disney+ |
| Spongebob Squarepants |
8
|
741 741 | 336 | Paramount+ |
| The Diplomat |
9
|
730 730 | 30 | Netflix |
| Bob's Burgers |
10
|
673 673 | 307 | Hulu |
Oct. 26 – Nov. 01, 2026
| Program Name | Rank | Minutes (Millions) | # of Episodes | Streaming Provider(s) |
|---|---|---|---|---|
| Nobody Wants This |
1
|
847 | 30 | Netflix |
| Love Is Blind |
2
|
796 | 147 | Netflix |
| The Terminal List |
3
|
779 | 16 | Prime Video |
| The Diplomat |
4
|
730 | 30 | Netflix |
| Lupin |
5
|
579 | 25 | Netflix |
| VisionQuest |
6
|
548 | 6 | Disney+ |
| The One About Matthew Perry |
7
|
541 | 3 | Netflix |
| Crystal Lake |
8
|
514 | 8 | Peacock |
| Tulsa King |
9
|
501 | 32 | Paramount+ |
| Carrie |
10
|
436 | 8 | Prime Video |
Oct. 26 – Nov. 01, 2026
| Program Name | Rank | Minutes (Millions) | # of Episodes | Streaming Provider(s) |
|---|---|---|---|---|
| From |
1
|
2,043 | 30 | Netflix |
| Grey's Anatomy |
2
|
889 | 470 | Hulu | Netflix |
| The Big Bang Theory |
3
|
781 781 | 279 | HBO Max |
| Bluey |
4
|
754 754 | 154 | Disney+ |
| Spongebob Squarepants |
5
|
741 741 | 336 | Paramount+ |
| Bob's Burgers |
6
|
673 673 | 307 | Hulu |
| South Park |
7
|
564 564 | 326 | Paramount+ |
| NCIS |
8
|
554 554 | 512 | Hulu | Netflix | Paramount+ | Pluto TV |
| The First 48 |
9
|
540 540 | 506 | Hulu | Netflix | Peacock | Pluto TV |
| Family Guy |
10
|
515 515 | 470 | Hulu |
Oct. 26 – Nov. 01, 2026
| Program Name | Rank | Minutes (Millions) | Streaming Provider(s) |
|---|---|---|---|
| Hocus Pocus |
1
|
405 | Disney+ |
| Minions & Monsters |
2
|
399 | Peacock |
| The Nightmare Before Christmas |
3
|
389 | Disney+ |
| Coraline |
4
|
275 | HBO Max | Hulu | Peacock |
| Moana (2026) |
5
|
273 | Disney+ |
| Coco |
6
|
228 | Disney+ |
| Champions |
7
|
215 | Netflix |
| Hocus Pocus 2 |
8
|
207 | Disney+ |
| Surviving Hurricane Otis |
9
|
183 | Netflix |
| Gladiator II |
10
|
180 | Netflix | Paramount+ |
SOURCE: Nielsen Streaming Content Ratings (Amazon Prime Video, Apple TV, Disney+, HBO Max, Hulu, Netflix, Paramount+, Peacock, Pluto TV, Starz), Nielsen National TV Panel, U.S., viewing through television.
NOTE: Streaming platforms featured in the Streaming Top 10 charts include only those streaming providers with program-level data in specific Nielsen reporting systems. However, viewing data are inclusive of streaming viewership to all platforms beyond the listed providers.
Related Insights
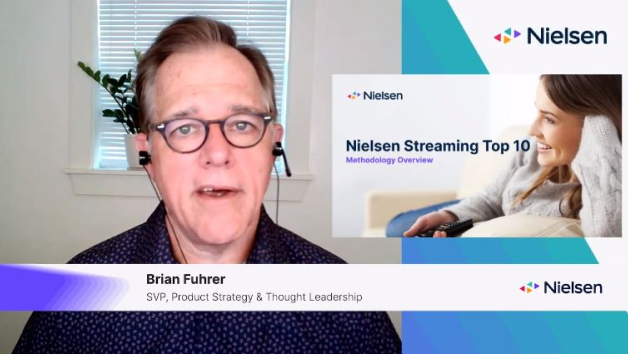
Methodology Overview
Learn more about how we measure streaming content and calculate the streaming Top 10 lists in this video with Nielsen SVP Brian Fuhrer.
Related Product

Streaming Content Ratings
Uncover the viewing habits of streaming audiences to gain a more comprehensive view of your video content’s reach, regardless of where consumers view it.
Linear TV
Top 10
Broadcast, cable, syndication and live streaming programs
Discover the week’s top TV programs among U.S. audiences across broadcast, cable, syndication and live streaming, including a total, combined* view. Viewership is based on Nielsen Big Data + Panel measurement and ranked by total viewers (Persons 2+).
Week of Nov. 02 – Nov. 08, 2026
| PROGRAM | RANK | VIEWERS P2+ (000) | HHLD RATING | ORIGINATOR |
|---|---|---|---|---|
| FOX NFL SUNDAY – NATIONAL (4:25P) |
1
|
25,748 | 11.6 | FOX |
| NBC SUNDAY NIGHT FOOTBALL – BUCCANEERS VS. BEARS |
2
|
21,474 | 10.4 | NBC |
| CBS NFL SINGLE (1:00P) |
3
|
18,922 | 8.7 | CBS |
| SUNDAY NIGHT NFL PRE-KICK |
4
|
16,814 | 8.0 | NBC |
| NFL REGULAR SEASON W/OTA – BEARS VS. SEAHAWKS |
5
|
15,417 | 7.3 | ESPN OTA |
| THURSDAY NIGHT FOOTBALL – JAGUARS VS. RAVENS |
6
|
13,964 | 6.4 | PRIME VIDEO |
| FOX NFL SUNDAY – REGIONAL (1:00P) |
7
|
12,081 | 5.7 | FOX |
| FOOTBALL NT AMERICA PT 3 |
8
|
10,923 | 5.1 | NBC |
| THE OT |
9
|
10,795 | 5.2 | FOX |
| ABC WORLD NEWS TONIGHT |
10
|
9,521 9,521 | 5.5 | ABC |
Week of Nov. 02 – Nov. 08, 2026
| PROGRAM | RANK | VIEWERS P2+ (000) | HHLD RATINGt | ORIGINATOR |
|---|---|---|---|---|
| FOX NFL SUNDAY – NATIONAL (4:25P) |
1
|
25,748 | 11.6 | FOX |
| NBC SUNDAY NIGHT FOOTBALL – BUCCANEERS VS. BEARS |
2
|
21,474 | 10.4 | NBC |
| CBS NFL SINGLE (1:00P) |
3
|
18,922 | 8.7 | CBS |
| SUNDAY NIGHT NFL PRE-KICK |
4
|
16,814 | 8.0 | NBC |
| FOX NFL SUNDAY – REGIONAL (1:00P) |
5
|
12,081 | 5.7 | FOX |
| FOOTBALL NT AMERICA PT 3 |
6
|
10,923 | 5.1 | NBC |
| THE OT |
7
|
10,795 | 5.2 | FOX |
| ABC WORLD NEWS TONIGHT (MWTh) |
8
|
9,143 9,143 | 5.4 | ABC |
| ABC AFTERNOON CFTBL – ALABAMA VS. LSU |
9
|
8,856 8,856 | 4.0 | ABC |
| ABC WORLD NEWS TONIGHT (FRI) |
10
|
8,517 8,517 | 5.1 | ABC |
Week of Nov. 02 – Nov. 08, 2026
| PROGRAM | RANK | VIEWERS P2+ (000) | HHLD RATING | ORIGINATOR |
|---|---|---|---|---|
| NFL REGULAR SEASON – BEARS VS. SEAHAWKS |
1
|
13,943 | 6.6 | ESPN |
| MONDAY NIGHT KICKOFF |
2
|
7,140 | 3.4 | ESPN |
| NFLN EXCLUSIVE GAME – BENGALS VS. FALCONS |
3
|
5,494 5,494 | 2.6 | NFL NETWORK |
| COLLEGE FOOTBALL AFT – TEXAS VS. MISSOURI |
4
|
5,006 5,006 | 2.3 | ESPN |
| FOX NEWS DEMOCRACY 26 (9:00P) |
5
|
4,600 4,600 | 2.5 | FOX NEWS CHANNEL |
| MONDAY NIGHT POSTGAME |
6
|
4,591 4,591 | 2.4 | ESPN |
| FOX NEWS DEMOCRACY 26 (8:00P) |
7
|
4,389 4,389 | 2.4 | FOX NEWS CHANNEL |
| ELECTION NIGHT IN AMERICA (10:00P) |
8
|
4,351 4,351 | 2.3 | CNN |
| ELECTION NIGHT IN AMERICA (9:00P) |
9
|
4,345 4,345 | 2.3 | CNN |
| WE THE PEOPLE – MIDTERM ELECTIONS |
10
|
3,998 3,998 | 2.3 | MS NOW |
Week of Oct. 19 – Oct. 25, 2026
| PROGRAM | RANK | VIEWERS P2+ (000) | HHLD RATING | ORIGINATOR |
|---|---|---|---|---|
| WHEEL OF FORTUNE |
1
|
8,498 | 4.7 | CBS MEDIA VENTURES |
| JEOPARDY |
2
|
8,203 | 4.8 | CBS MEDIA VENTURES |
| FAMILY FEUD |
3
|
7,602 | 4.7 | CBS MEDIA VENTURES |
| JUDGE JUDY |
4
|
5,198 | 3.4 | CBS MEDIA VENTURES |
| INSIDE EDITION |
5
|
2,950 2,950 | 1.9 | CBS MEDIA VENTURES |
| DATELINE (WKLY) |
6
|
2,846 2,846 | 2.0 | NBC UNIVERSAL |
| WEEKEND ADVENTURE |
7
|
2,811 2,811 | 1.9 | HMPG/DADT |
| ENTERTAINMENT TONIGHT |
8
|
2,745 2,745 | 1.7 | CBS MEDIA VENTURES |
| FAMILY FEUD (WKND) |
9
|
2,490 2,490 | 1.6 | CBS MEDIA VENTURES |
| LIVE WITH KELLY AND MARK |
10
|
2,383 2,383 | 1.6 | DISNEY ABC DOMEST TV |
Source: Nielsen Big Data + Panel National TV Measurement. U.S. audiences. Ranked on P2+ average audience projections (total viewers). Household ratings are the percentage of TV homes tuned into a specific television program.
* The “Total” chart includes broadcast, cable and live streaming programs and does not include syndication programs due to syndication data availability.
Viewing by demographic
Dive deeper into the data with the top-ranked prime broadcast and cable TV programs for Hispanic viewers, Black viewers and viewers in households with same gender spouses or unmarried partners in the U.S.
Week of July 22 – July 28, 2024
| PROGRAM | RANK | VIEWERS (000) | RATING | NETWORK |
|---|---|---|---|---|
| PREMIOS JUVENTUD 24 7/25 |
1
|
1,324 | 4.8 | UNI |
| NOCHE DE ESTRELLAS 7/25 |
2
|
1,221 | 4.6 | UNI |
| TOP CHEF VIP S3 – M |
3
|
1,146 | 4.1 | TEL |
| PREMIOS JUVENTUD24 GF7/25 |
4
|
1,136 | 4.4 | UNI |
| CONDE: AMOR Y HONOR – M |
5
|
1,121 | 4.0 | TEL |
| TOP CHEF VIP S3 – SUN |
6
|
1,094 | 3.6 | TEL |
| TOP CHEF VIP S3 7P – M |
7
|
1,082 | 3.9 | TEL |
| TOP CHEF VIP S3 – W |
8
|
1,061 | 4.0 | TEL |
| TOP CHEF VIP S3 – R |
9
|
1,054 | 4.3 | TEL |
| TOP CHEF VIP S3 – T |
10
|
1,021 | 3.9 | TEL |
| PROGRAM | RANK | VIEWERS (000) | RATING | NETWORK |
|---|---|---|---|---|
|
1
| ||||
|
2
| ||||
|
3
| ||||
|
4
| ||||
|
5
| ||||
|
6
| ||||
|
7
| ||||
|
8
| ||||
|
9
| ||||
|
10
|
Source: Nielsen. Primetime broadcast programs. Viewing estimates on this page include live viewing and DVR playback on the same day, defined as 3am-3am. Ratings are the percentage of TV viewers in the U.S. that tuned into a television program.
Related Product

Nielsen TV Ratings
Discover what U.S. audiences are watching—where, when, and how often to determine how to best allocate advertising spend, sponsorship, and marketing dollars.
Related Insights

Ratings and Families
How do Nielsen ratings work? It starts with the Nielsen Families that help us measure what people watch on TV and listen to on the radio.
Advertising
Top 10
Learn which companies are leading the pack in advertising spending each month. Powered by Nielsen Ad Intel.
Advertising Spend – January 2026, P2+
| PARENT COMPANY | RANK | DOLLARS (MM) | IMPRESSIONS (B) | INDUSTRY |
|---|---|---|---|---|
| ABBVIE INC |
1
|
$117.1 | 9.7 | HEALTHCARE |
| VERIZON COMMUNICATIONS INC |
2
|
$108.8 | 4.4 | BUSINESS & CONSUMER SVCS |
| JOHNSON & JOHNSON |
3
|
$98.5 | 3.2 | HEALTHCARE |
| HONDA MOTOR CO LTD |
4
|
$87.1 | 1.1 | AUTOMOTIVE |
| FOX CORP |
5
|
$85.7 | 2.8 | PUBLISHING & MEDIA |
| GENERAL MOTORS CO |
6
|
$80.8 | 1.9 | AUTOMOTIVE |
| BERKSHIRE HATHAWAY INC |
7
|
$75.4 | 2.5 | INSURANCE & REAL ESTATE |
| YUM! BRANDS INC |
8
|
$73.5 | 3.0 | ENTERTAINMENT & AMUSEMENTS |
| INTUIT INC |
9
|
$71.3 | 3.7 | COMPUTERS, OFF. EQUIP. & STATIONERY |
| ROARK CAPITAL GROUP INC |
10
|
$66.0 | 5.7 | ENTERTAINMENT & AMUSEMENTS |
January 2026, P2+
| PARENT COMPANY | RANK | DOLLARS (MM) | IMPRESSIONS (MM) | INDUSTRY |
|---|---|---|---|---|
| SAINT JUDE CHILDRNS RSRCH HSPTL INC |
1
|
$13.8 | 408.7 | HEALTHCARE |
| BRAND GROUP LLC |
2
|
$9.7 | 15.7 | DIRECT RESPONSE PRODUCTS |
| AT&T INC |
3
|
$8.9 | 431.4 | BUSINESS & CONSUMER SVCS |
| PARKINSONS FNDN INC |
4
|
$8.2 | 86.4 | BUSINESS & CONSUMER SVCS |
| SANDY HOOK PROMISE FNDN INC |
5
|
$8.1 | 48.1 | BUSINESS & CONSUMER SVCS |
| ALLSTATE CORP |
6
|
$7.3 | 119.3 | INSURANCE & REAL ESTATE |
| AMERICAN SOCIETY PRVT CRLY ANLS INC |
7
|
$7.3 | 151.9 | BUSINESS & CONSUMER SVCS |
| BLOOD CANCER UNITED INC |
8
|
$7.0 | 4.5 | BUSINESS & CONSUMER SVCS |
| TOYOTA MOTOR CORP |
9
|
$6.6 | 200.3 | AUTOMOTIVE |
| MCDONALDS CORP |
10
|
$6.2 | 444.8 | ENTERTAINMENT & AMUSEMENTS |
January 2026, P2+
| PARENT COMPANY | RANK | DOLLARS (MM) | IMPRESSIONS (B) | INDUSTRY |
|---|---|---|---|---|
| TOYOTA MOTOR CORP |
1
|
$49.8 | 2.4 | AUTOMOTIVE |
| GENERAL MOTORS CO |
2
|
$48.0 | 3.3 | AUTOMOTIVE |
| MORGAN & MORGAN PA |
3
|
$36.0 | 2.9 | BUSINESS & CONSUMER SVCS |
| COMCAST CORP |
4
|
$25.8 | 1.1 | BUSINESS & CONSUMER SVCS |
| FORD MOTOR CO |
5
|
$22.9 | 1.4 | AUTOMOTIVE |
| ABBVIE INC |
6
|
$22.6 | 0.7 | HEALTHCARE |
| HYUNDAI MOTOR CO |
7
|
$22.0 | 1.3 | AUTOMOTIVE |
| INVESTINDUSTRIAL INC |
8
|
$21.2 | 0.3 | BUSINESS & CONSUMER SVCS |
| UNITED STATES GOVERNMENT |
9
|
$20.8 | 0.8 | BUSINESS & CONSUMER SVCS |
| DRS OWN LLC |
10
|
$20.5 | 1.5 | RETAIL |
January 2026, P2+
| PARENT COMPANY | RANK | DOLLARS (MM) | IMPRESSIONS (MM) | INDUSTRY |
|---|---|---|---|---|
| RTG FURNITURE CORP |
1
|
$2.2 | 159.0 | RETAIL |
| SEARCHLIGHT CAPITAL PARTNERS LP |
2
|
$1.6 | 208.2 | PUBLISHING & MEDIA |
| UNITEDHEALTH GROUP INC |
3
|
$1.5 | 52.4 | INSURANCE & REAL ESTATE |
| NEW YORK STATE OF |
4
|
$1.5 | 171.3 | BUSINESS & CONSUMER SVCS |
| CHARTER COMMUNICATIONS INC |
5
|
$1.4 | 120.6 | BUSINESS & CONSUMER SVCS |
| PHYSICIANS MUTUAL INSURANCE CO |
6
|
$1.4 | 41.2 | INSURANCE & REAL ESTATE |
| TOYOTA MOTOR CORP |
7
|
$1.4 | 109.8 | AUTOMOTIVE |
| USA VEIN CLINICS LLC |
8
|
$1.3 | 80.8 | HEALTHCARE |
| NISSAN MOTOR CO LTD |
9
|
$1.3 | 123.6 | AUTOMOTIVE |
| COMCAST CORP |
10
|
$1.2 | 67.9 | BUSINESS & CONSUMER SVCS |
Source: Nielsen Ad Intel notes: Excludes PSAs. Spot TV Live+7 for P2+. Spot TV is inclusive of Nielsen’s top 10 Hispanic DMAs based on TV households. Political advertising pricing varies by station and is subject to change, therefore cannot be compared to previous time periods.
Note: Uncategorized promotional ad spend and impression data excluded from chart.
Related Product

Ad Intel
Set your brand apart from the competition with advertising intelligence across channels and platforms, including TV, print, digital, out-of-home, and cinema.
Video Games
Top 10
Discover the top video games Americans are looking to buy next.
Week ended November 14, 2026 | Console and PC
| TITLE | RANK | Previous week's rankings |
|---|---|---|
| Grand Theft Auto VI | 1 | 1 |
| Marvel's Wolverine | 2 | 3 |
| Grand Theft Auto V (PS4, Xbox One, PC) | 2 | 16 |
| Grand Theft Auto V (PS5, Xbox Series X) | 2 | 16 |
| The Legend of Zelda: Ocarina of Time | 5 | 6 |
| Fortnite | 5 | 7 |
| Fable | 7 | 7 |
| Monster Hunter Wilds | 8 | 2 |
| Minecraft | 8 | 3 |
| Until Dawn 2 | 8 | 16 |
Source: Nielsen Video Games Tracking