As U.S. consumers eye a selection of video game consoles this holiday season, their choices offer an increasing array of entertainment features beyond traditional offline gaming. While gaming remains at the forefront of how users say they spend their time with a console, online play and movie/TV show-viewing represent important, but differing aspects, of overall use when comparing Microsoft Xbox 360 to Sony PlayStation 3 to Nintendo Wii. What emerges is a unique profile for each console.
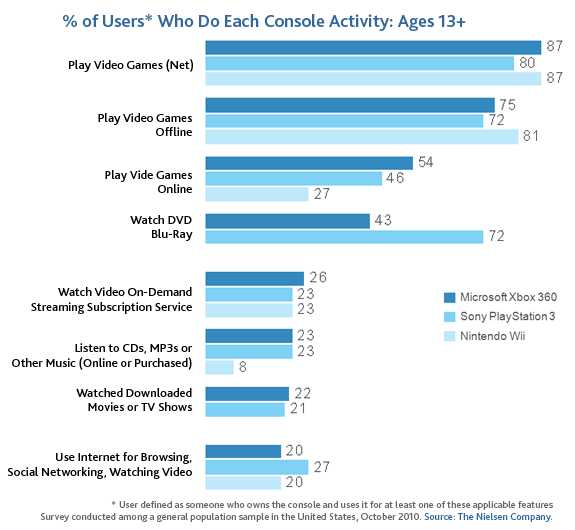
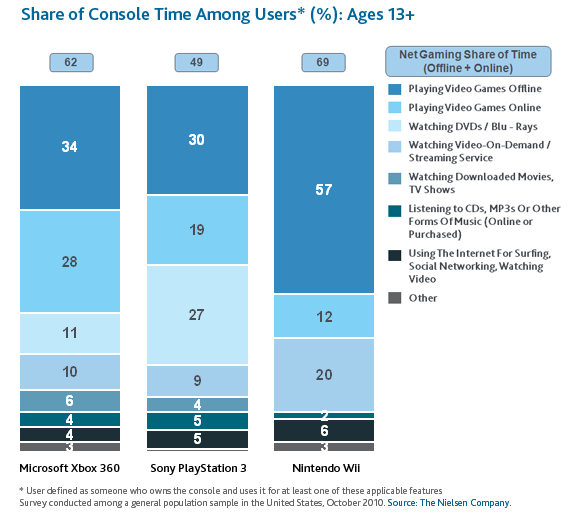
Fully 87 percent of users age 13+ say they have played video games of some kind for Xbox 360 and Wii, with 80 percent saying they have done so for PlayStation 3. Much of this is the result of traditional offline play, but nearly half of Xbox 360 and PlayStation 3 users say they play games online. With this in mind, what share of time do both offline and online gaming account for across these consoles? On average, Xbox 360 users claim to spend 62 percent of their time with the system on gaming, with online play accounting for nearly the same share as offline. Comparatively, PlayStation 3 users spend just under half of their usage time gaming, and engage relatively more in offline vs. online play than Xbox 360 users. This difference between the relative proportion of online play for Microsoft and Sony’s consoles likely reflects a number of intertwined factors, such as timing of console launch, profile of players and console exclusives. Overall, what sets Xbox 360 apart from the other two consoles is the total share of time devoted to online play.

The second-most popular use of consoles is for watching DVDs/Blu-Rays, most noticeably for PlayStation 3 but also for Xbox 360 (DVD playback is not a standard feature on the Wii). Sony has made a point of emphasizing the Blu-Ray functionality in marketing for the PlayStation 3 since its launch in 2006, given the company’s broader interest in seeing that technology succeed. In terms of share of time, PlayStation 3 users indicate that DVD/Blu-Ray viewing occupies 27% of their time with the console, which is on-par with offline gaming and, in fact, surpasses online gaming. However, by comparison, DVD viewing occupies only 11% of time on an Xbox 360 (Blu-Ray format is not supported by Xbox 360). In sum, the PlayStation 3 stands out for its use as a DVD/Blu-Ray player as well as a gaming console.
After gaming and DVD/Blu-Ray viewing, roughly a quarter of users say they have used a variety of applications. The most notable in terms of contribution to console usage time is video-on-demand and streaming services such as Netflix, MLB Network and ESPN3, accounting for 20 percent of Wii users’ time, 10 percent of Xbox 360 users’ time and 9 percent of PlayStation 3 users’ time. What explains the Wii’s edge here and usage profile in general? Compared to the other two consoles, the bulk of time on the Wii is in the form of offline gaming; the system trails in use for online play. This may reflect the lesser emphasis on online applications and gameplay for the Wii in general. In terms of streaming, Netflix was introduced this year for the Wii, but its lead in share is likely a function of the fewer hours per user that is being divided up, as detailed below. Overall, the Wii is most defined by its use for traditional offline gaming.

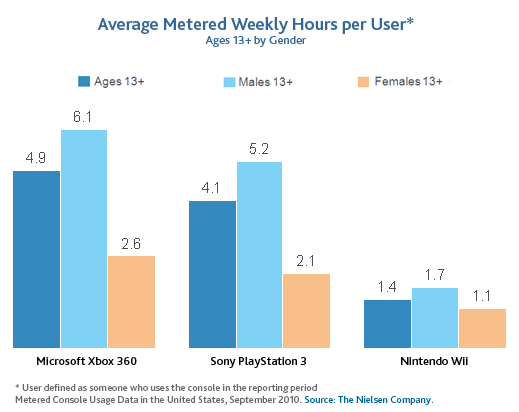
All of the analysis of console time up to this point has looked at consumer-reported share of time rather than electronically measured hours. Though a different data source, metered console usage data can help us understand how big the pie is that is being sliced for each console. Indeed, the total amount of time in hours differs markedly by console. Users 13+ spend 4.9 total hours per week on the Xbox 360, 4.1 hours on the PlayStation 3 and 1.4 hours on the Wii. Males drive these averages for all three consoles, surpassing females in time spent. These differences in time, coupled with the nuances in how that time is allocated, underscore the unique profile of use for each console.

More insights on gamers, console dynamics, and allocations of time and money within gaming and the broader entertainment category will be featured in the second annual Nielsen 360° Gaming Report: U.S. Market, available January 2011.


