Netflix, YouTube, Hulu and Amazon increase their monthly viewing shares
Amid the slowdown of new content on traditional television and reduced sports programming, streaming claimed the largest share of U.S. TV viewing in July—a first after four consecutive months of hitting new viewership highs. Streaming viewership in a given month has exceeded broadcast viewing before, but this is the first time it has also surpassed cable viewing.
In addition to claiming the largest viewership share during the month, audiences watched an average of 190.9 billion minutes of streamed content per week—easily surpassing the 169.9 billion minutes that audiences watched during the pandemic lockdown period back in April 2020. Excluding the week of Dec. 27, 2021, the five weeks of July 2022 represent the highest-volume streaming weeks on record, according to Nielsen measurement.
Aside from the shifting viewership shares, total TV usage during the month was virtually identical to that of June, as well as July 2021. The trends continue to highlight that with other variables held constant, Americans are expanding their streaming consumption and the platforms that they use.
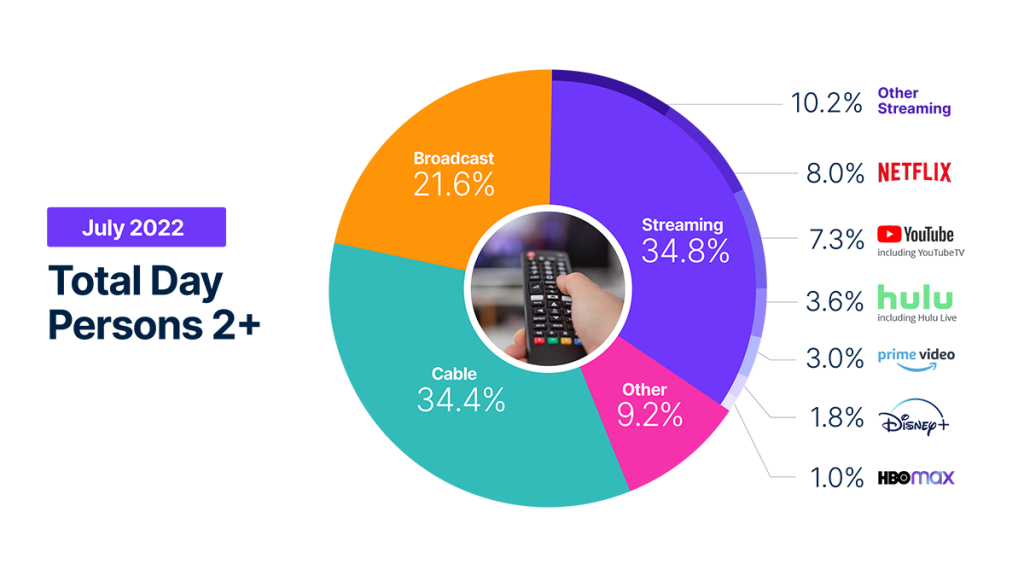
Overall, streaming usage grew 3.2% from June. On a year over year basis, streaming volume increased 22.6%, growing its share of usage by 6.5 points. In July, Prime Video, Hulu, Netflix and YouTube reached new heights again. Netflix gained 8% share, boosted by the nearly 18 billion minutes of Stranger Things that viewers watched, complemented by the nearly 11 billion minutes of combined viewing of Virgin River and The Umbrella Academy. Movies The Gray Man and The Sea Beast contributed over 5 billion minutes. Hulu’s record share was helped by the new season of Only Murders in the Building and The Bear, which combined for 3 billion minutes viewed. Amazon’s Prime Video’s 3.0 share was driven by the new series The Terminal List and new episodes of The Boys, which netted over 8 billion viewing minutes.
And with so much content entering the streaming space, both from the pure players and traditional media companies, it’s worth highlighting the impact of content from digital MVPDs (e.g., Hulu Live, YouTube TV) and traditional cable apps (Comcast, Charter/Spectrum). This content now represents 11.2% of streaming and 3.9% of total TV usage.
Broadcast, at 21.6% share of television, was down 3.7% on volume compared with last month, representing a 0.8 share point dip. On a year-over-year basis, the shift in viewing behavior is more evident, as broadcast viewing dropped 9.8% for a loss of 2.3 share points. Given the end of the NHL and NBA playoffs in June, the 41% drop in sports viewing was a factor in the drop. From last year, when there was some Olympics content in addition to NHL and NBA, the drop was 43%.
From June 2022, cable usage dropped 2%, resulting in a loss of 0.7 share points. From last July, cable usage was down 8.9% and 3.3 share points. Engagement with cable genres was fairly flat in July, with sports posting the biggest decline—dropping 15.4% for the month and 34% from a year ago.
Methodology and frequently asked questions
The Gauge provides a monthly macroanalysis of how consumers are accessing content across key television delivery platforms, including Broadcast, Streaming, Cable and Other sources. It also includes a breakdown of the major, individual streaming distributors. The chart itself shows the share by category and of total television usage by individual streaming distributors.
How is ‘The Gauge’ created?
The data for The Gauge is derived from two separately weighted panels and combined to create the graphic. Nielsen’s streaming data is derived from a subset of Streaming Meter-enabled TV households within the National TV panel. The linear TV sources (Broadcast and Cable), as well as total usage are based on viewing from Nielsen’s overall TV panel.
All the data is based on a specific time period for each viewing source. The data, representing a 5 week month, includes a combination of Live+7 for weeks 1 – 4 in the data time period. (Note: Live+7 includes live television viewing plus viewing up to seven days later. Live +3 includes television viewing plus viewing up to three days later.)
What is included in “Other”?
Within The Gauge, “Other” includes all other TV. This primarily includes all other tuning (unmeasured sources), unmeasured video on demand (VOD), streaming through a cable set top box, gaming, and other device (DVD playback) use. Because streaming via cable set top boxes does not credit respective streaming distributors, these are included in the “Other” category. Crediting individual streaming distributors from cable set top boxes is something Nielsen continues to pursue as we enhance our Streaming Meter technology.
What is included in “Other Streaming”?
Streaming platforms listed as “Other Streaming” includes any high-bandwidth video streaming on television that is not individually broken out.
Do you include live streaming on Hulu and YouTube?
Yes, Hulu includes viewing on Hulu Live and YouTube includes viewing on YouTube TV.
Encoded Live TV, aka encoded linear streaming, is included in both the Broadcast and Cable groups (linear TV) as well as under Streaming and other streaming e.g. Hulu Live, Youtube TV, Other Streaming MVPD/vMVPD apps. (Note: MVPD, or multichannel video programming distributor, is a service that provides multiple television channels. vMVPDs are distributors that aggregate linear (TV) content licensed from major programming networks and packaged together in a standalone subscription format and accessible on devices with a broadband connection.)