World Cup Games Generate 84 Billion Minutes Across FOX, Fox Sports 1 and NBCU’s Telemundo
FOX Owns Largest Monthly Share Gain and Viewing Increase in Nielsen’s June Media Distributor Gauge
Peacock’s ‘Love Island USA’ Commands Nearly 7 Billion Viewing Minutes as Most-Watched Streaming Title in June
ABC Nets Top Broadcast Telecasts with Games 3, 4 and 5 of NBA Finals
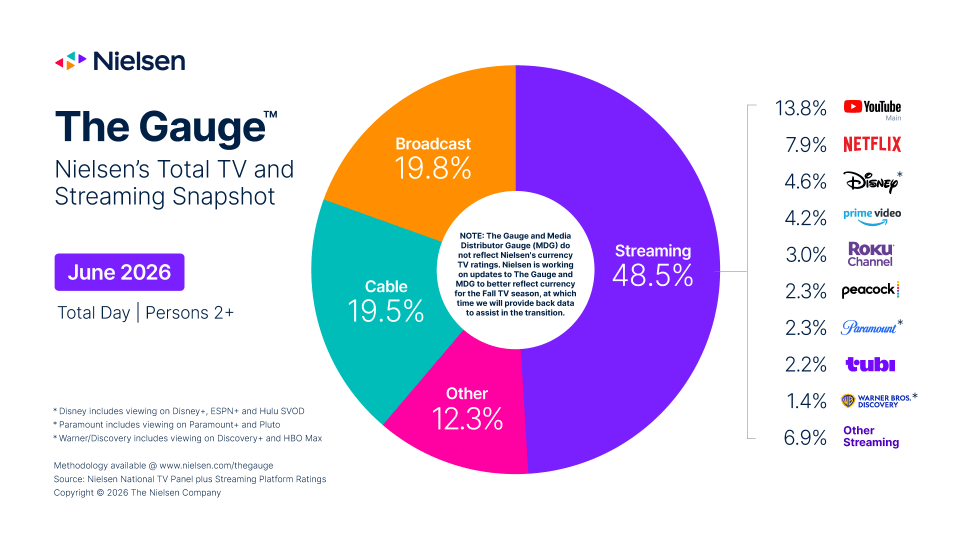
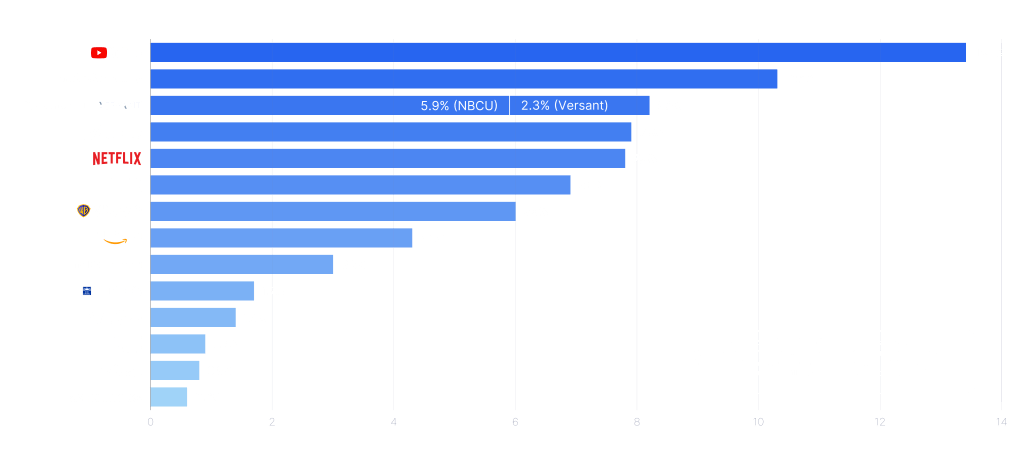
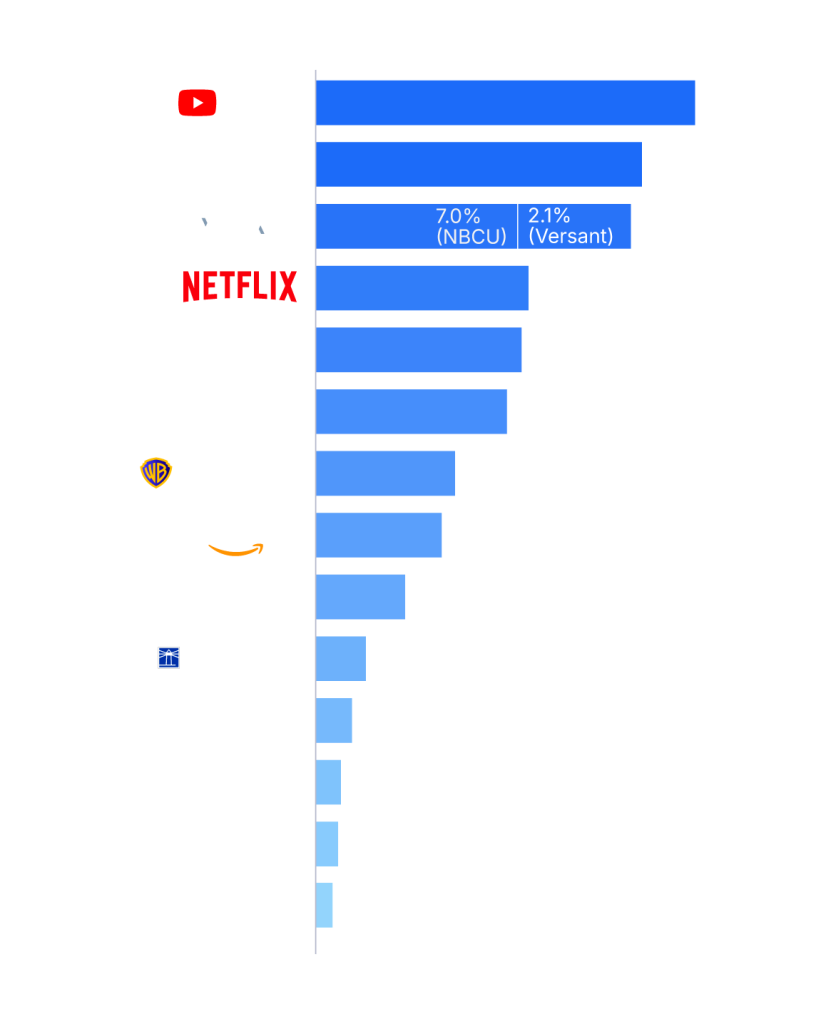
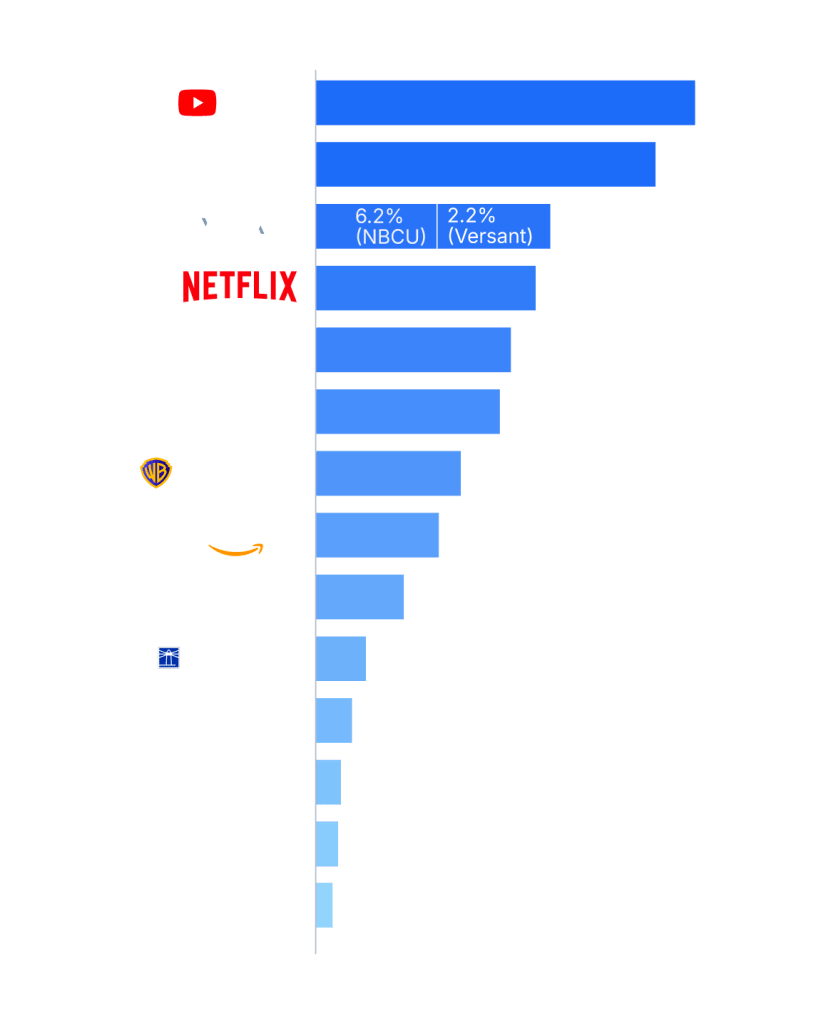
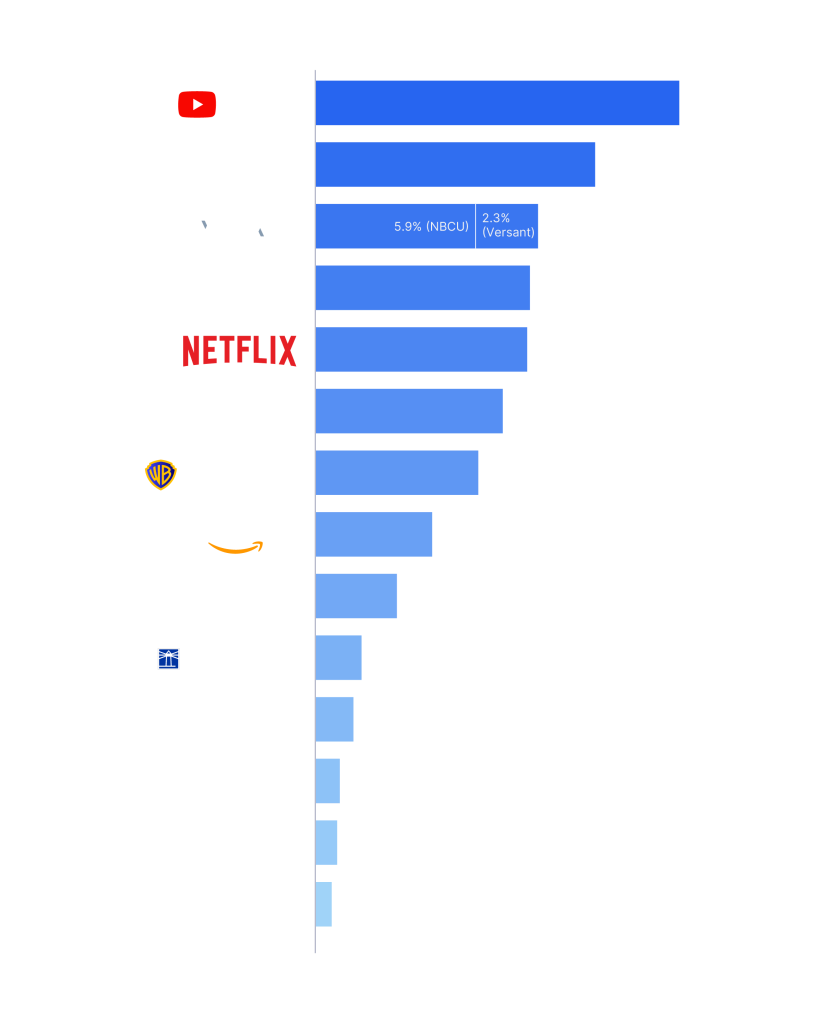
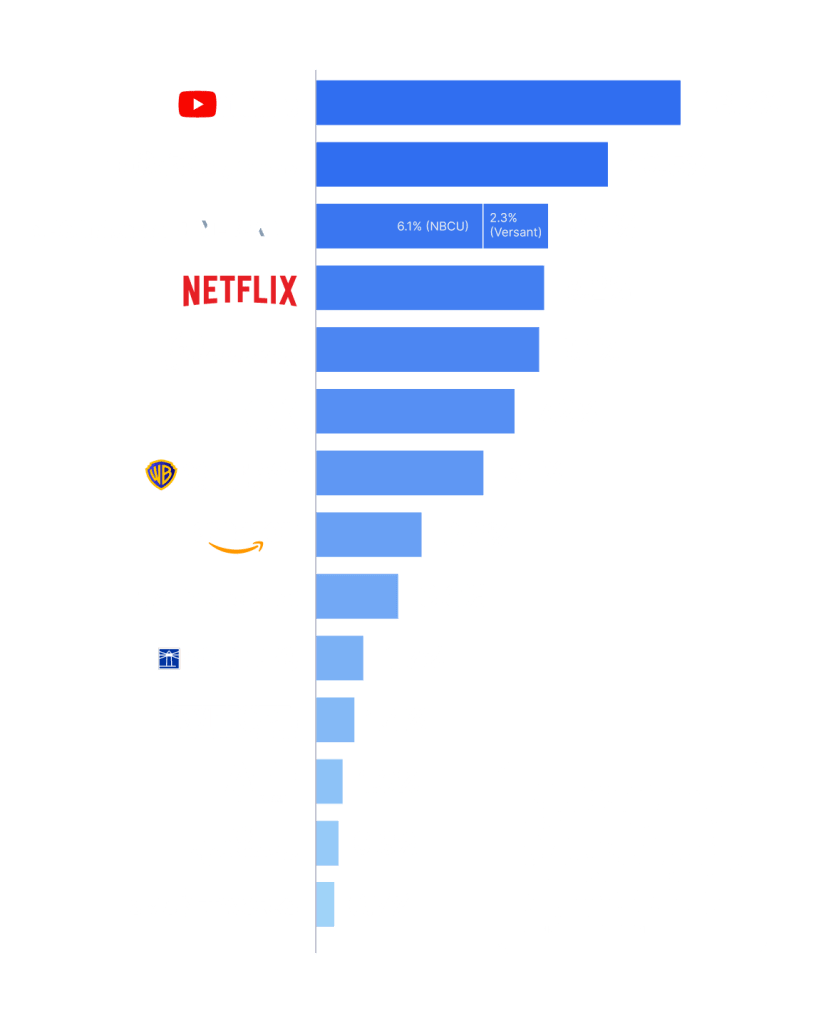
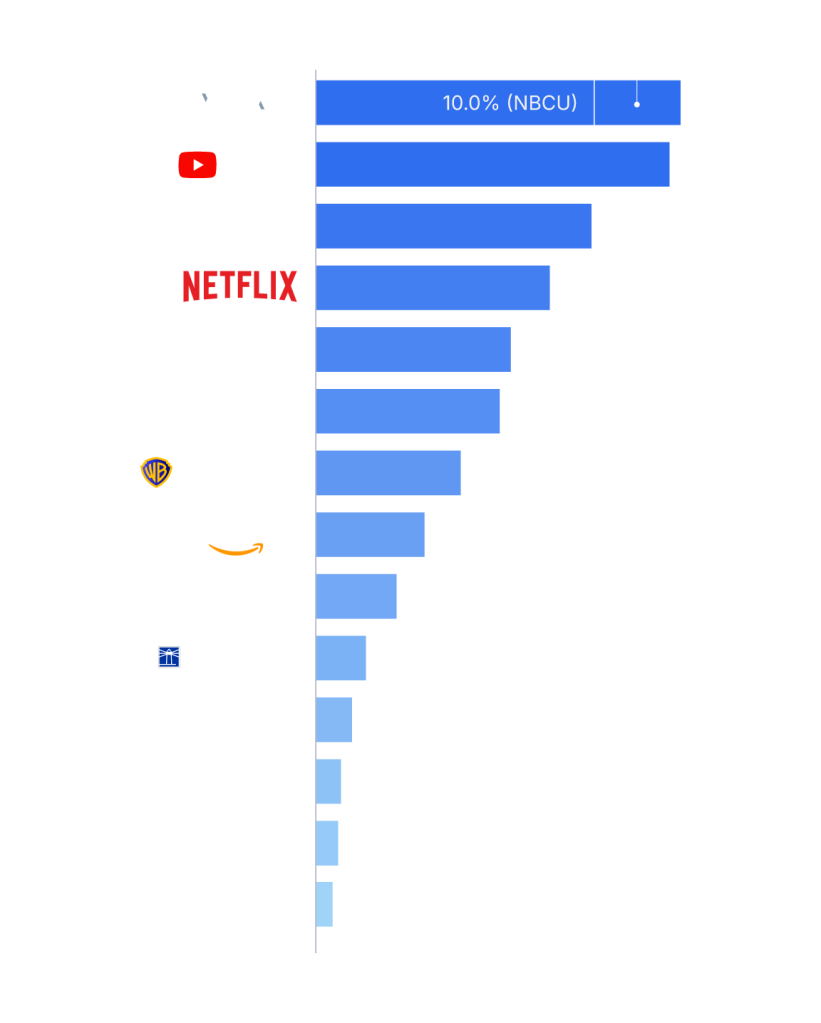
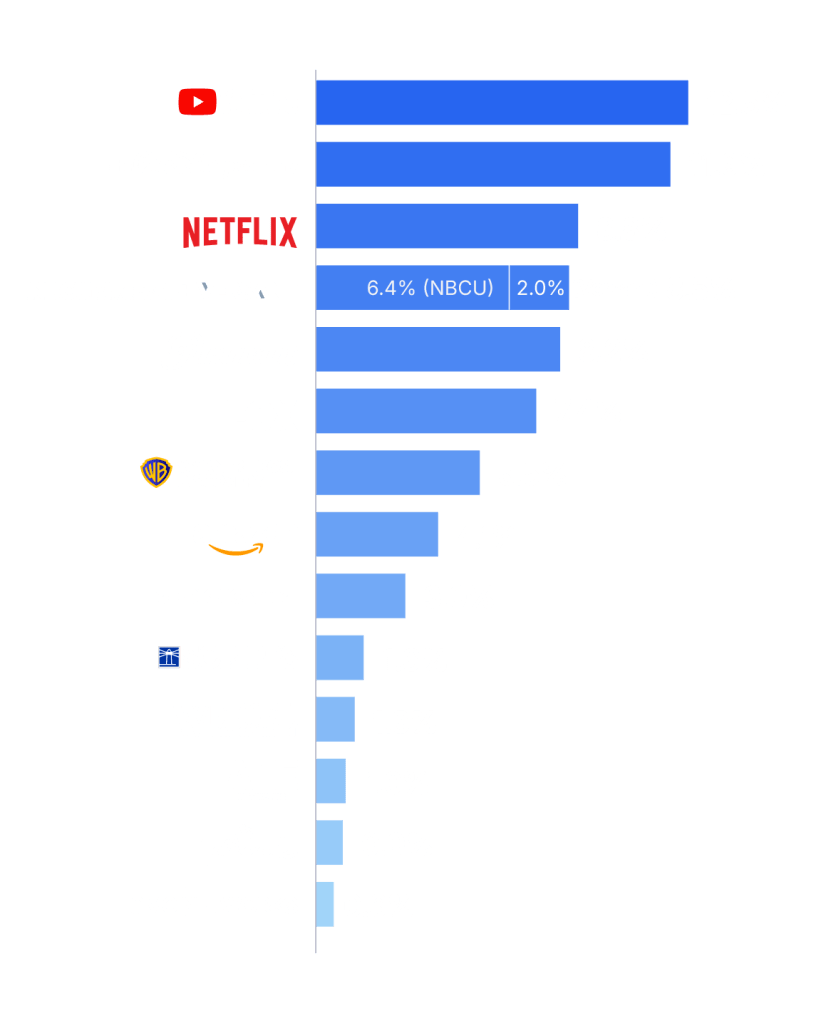
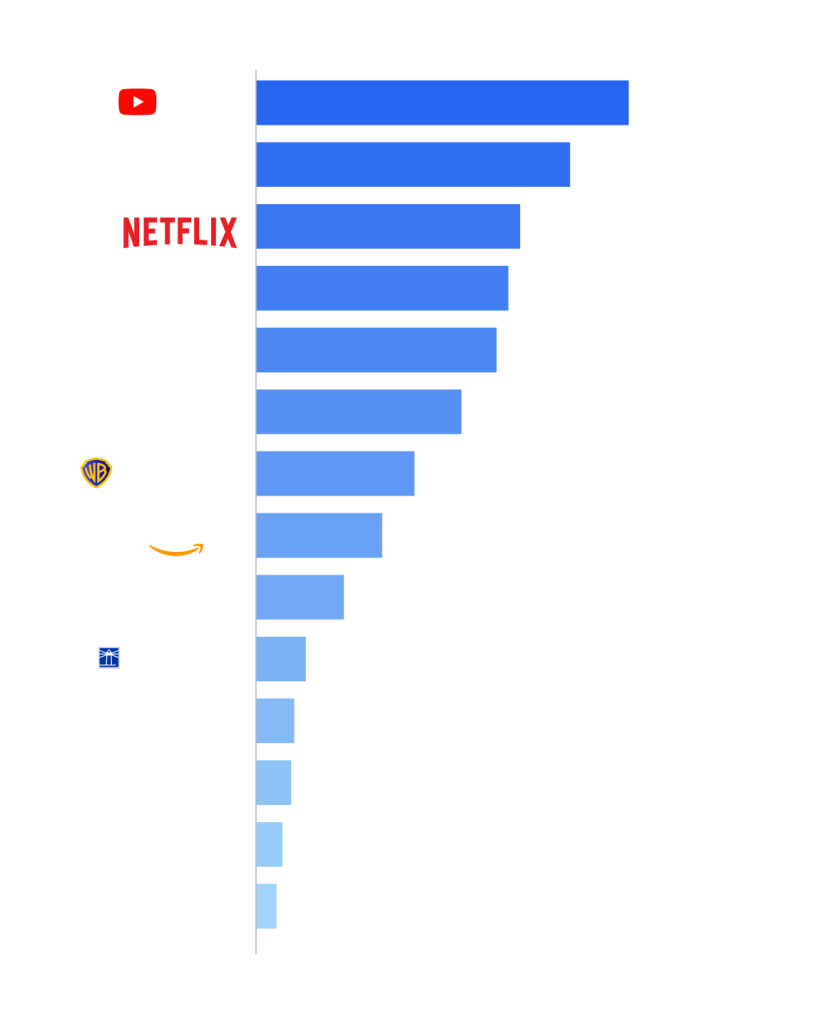
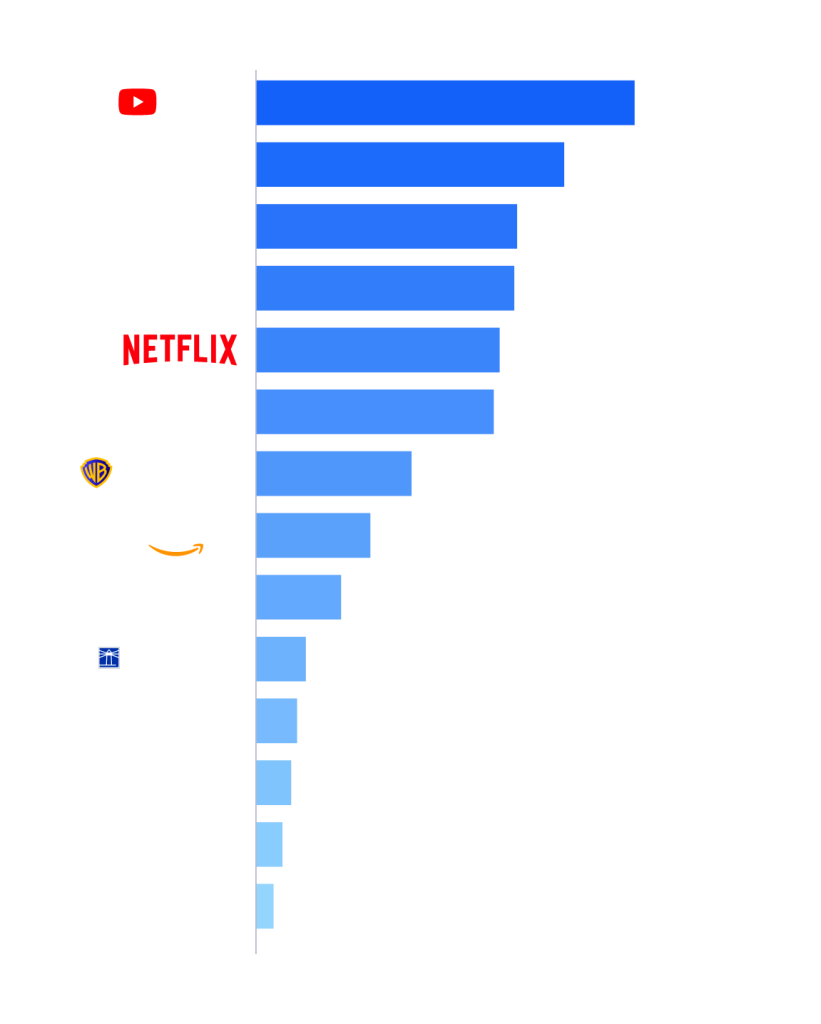
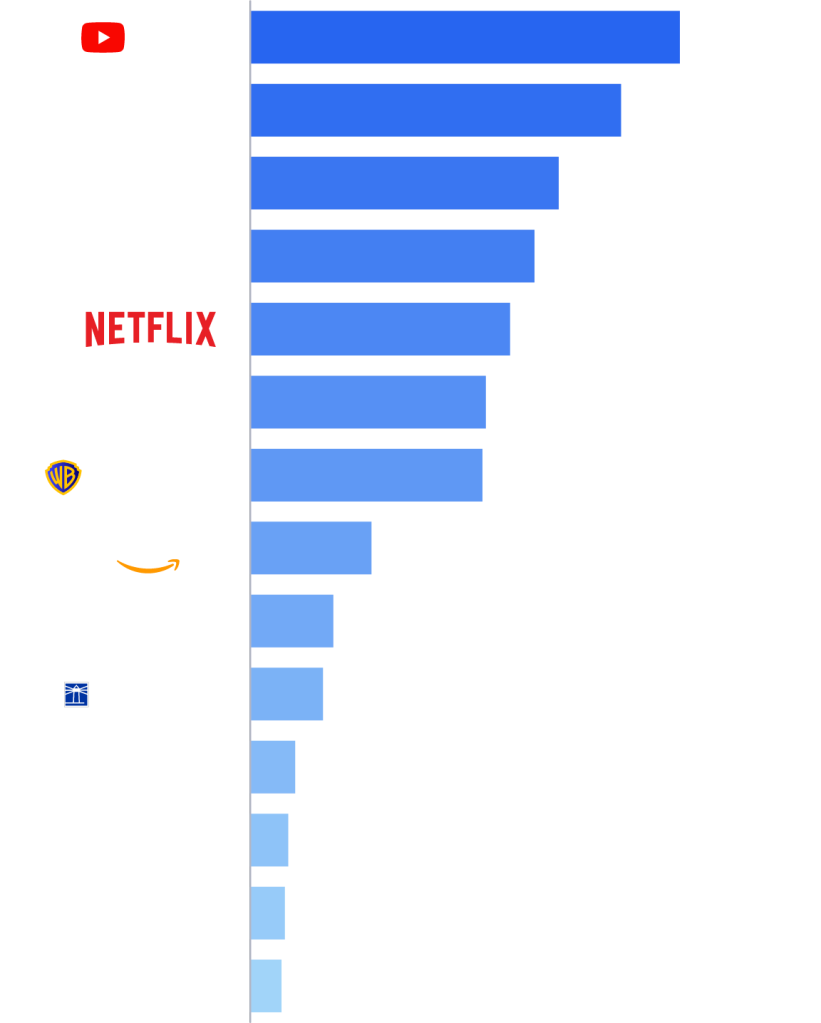
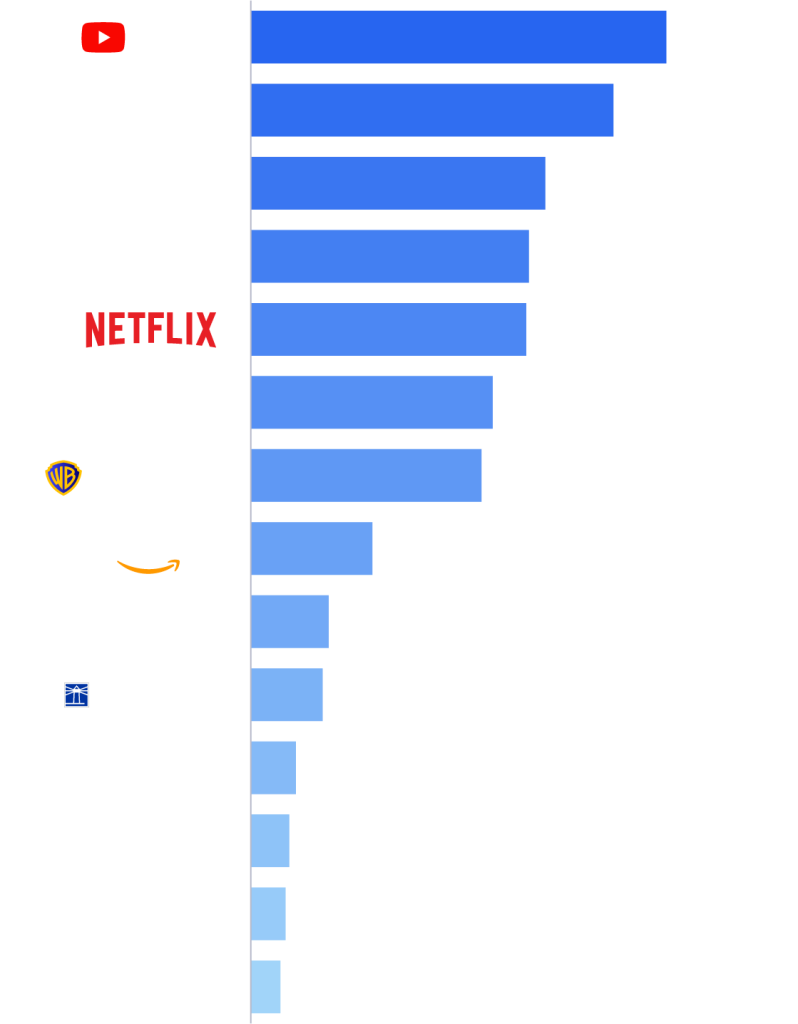
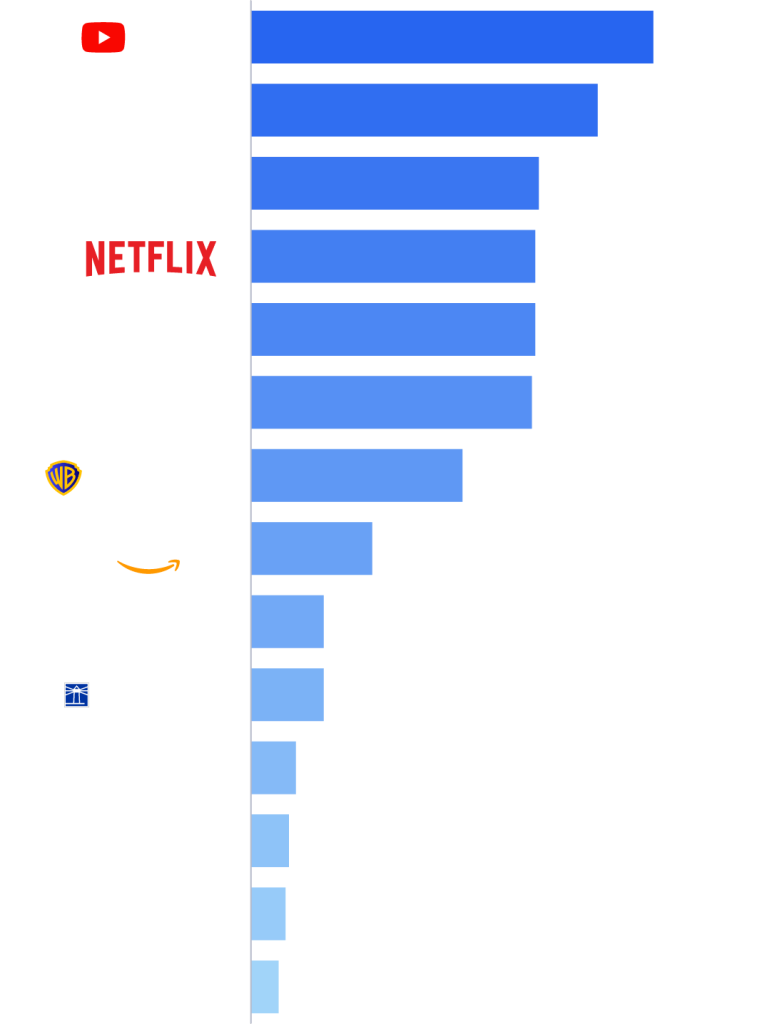
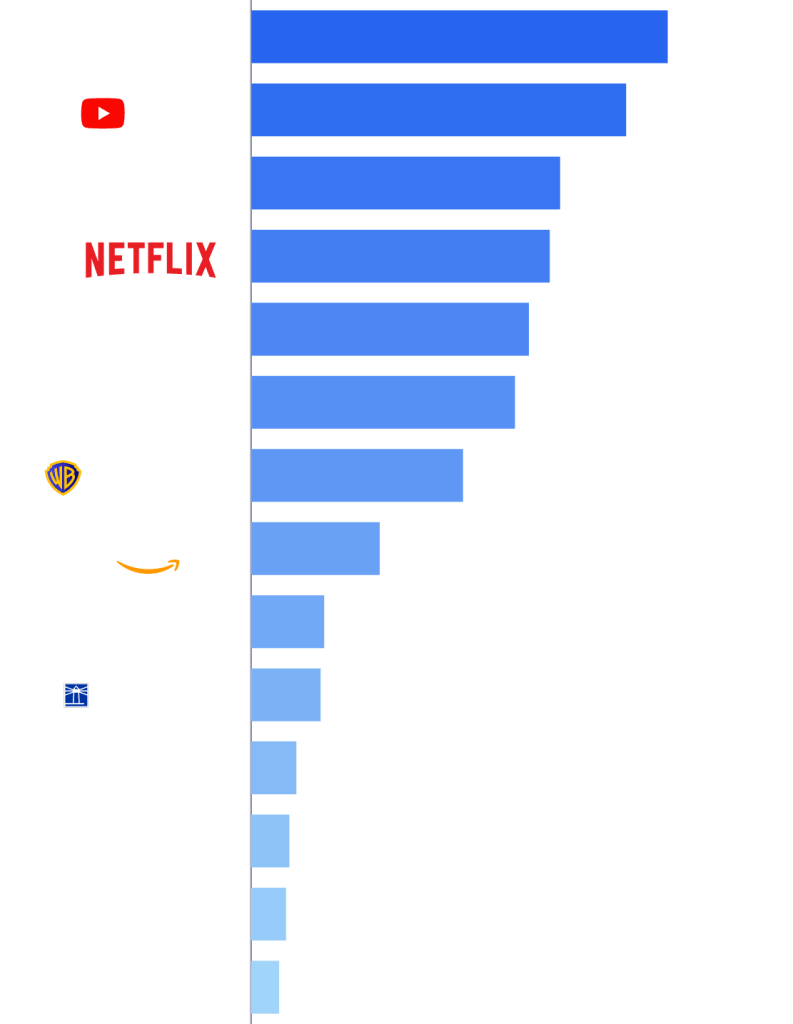
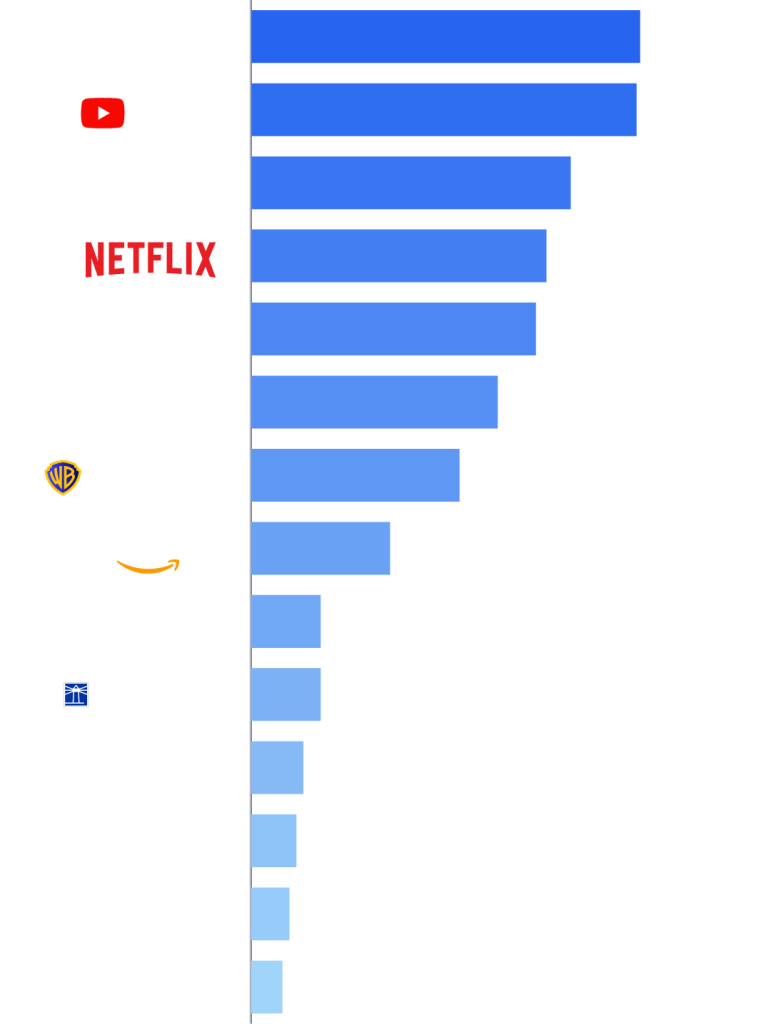
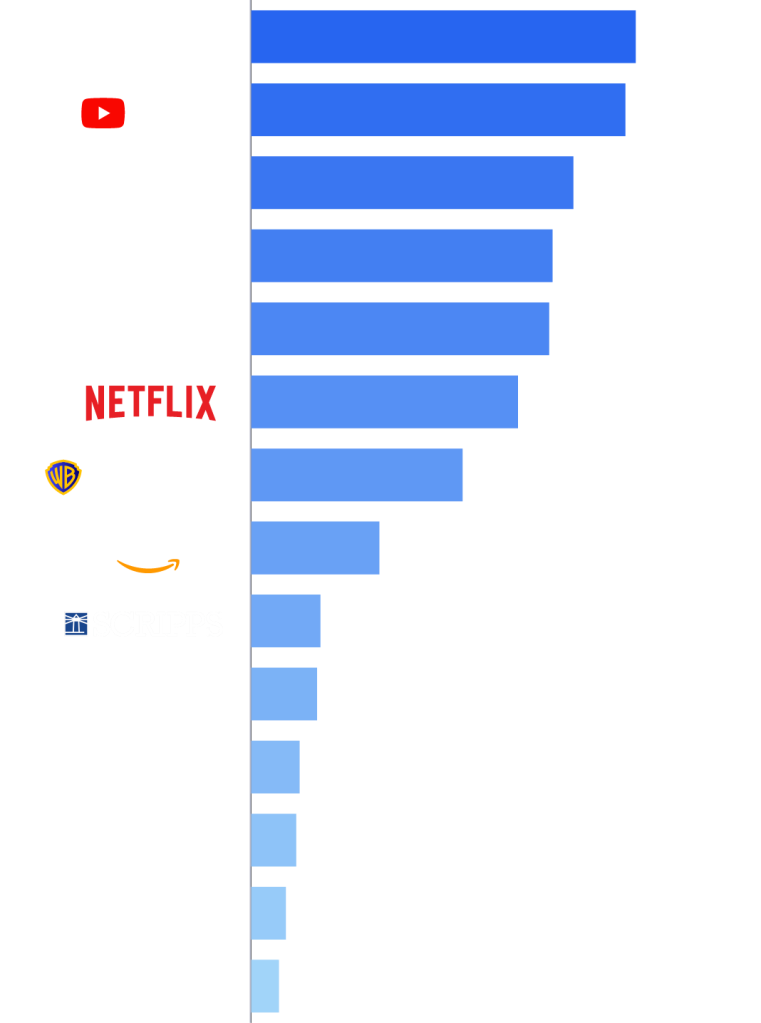
NEW YORK – August 18, 2026 – Nielsen’s June 2026 reports of The Gauge™ and Media Distributor Gauge revealed several key drivers that impacted television viewing trends: The highly anticipated FIFA World Cup 2026™ drove remarkable audience engagement with over 84 billion minutes viewed across FOX and NBCUniversal properties, leading both distributors to this month’s only viewing increases in the Media Distributor Gauge. Meanwhile, the combination of World Cup matches and NBA Finals games helped drive a 118% increase in broadcast sports viewing, and led the broadcast category to 19.8% of TV and its first increase during a June interval (+0.6 pts.) since the inception of The Gauge in 2021.
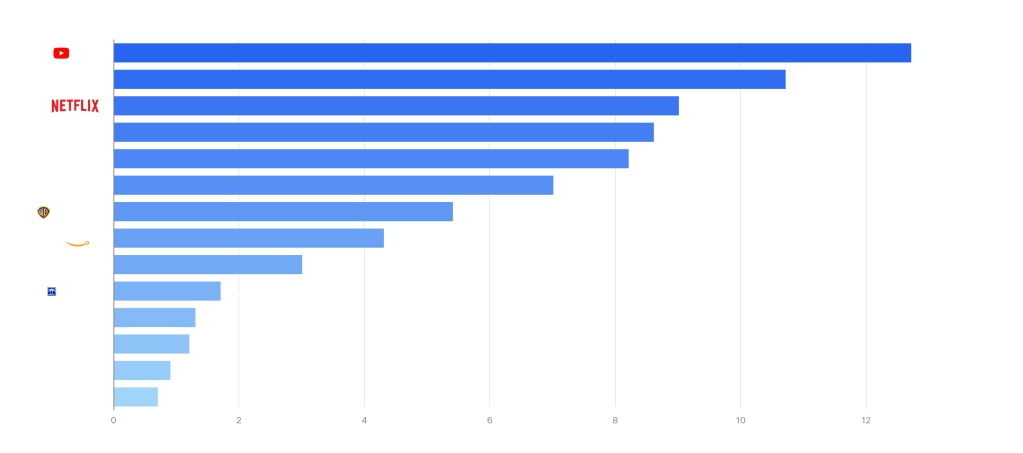
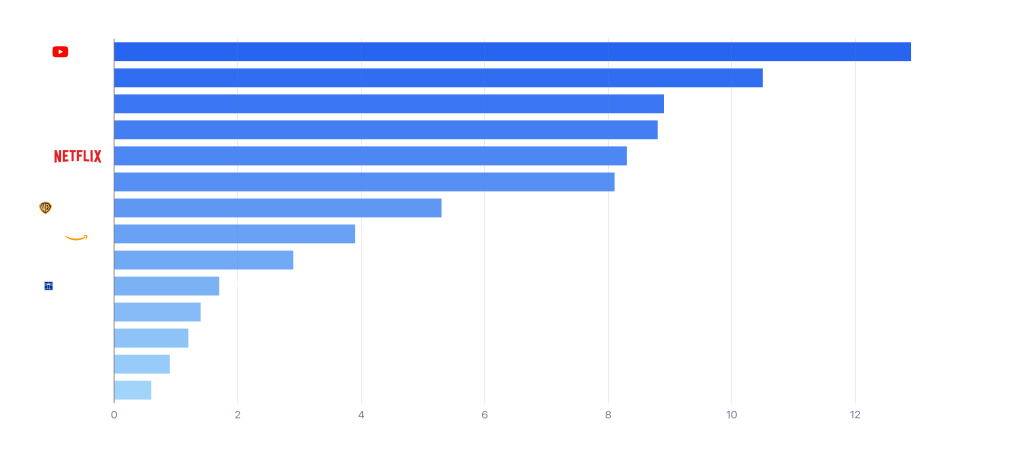
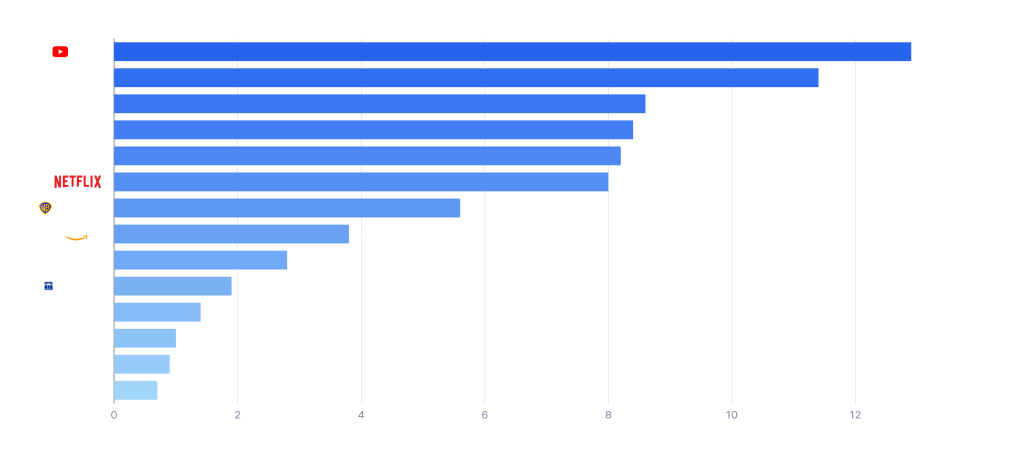
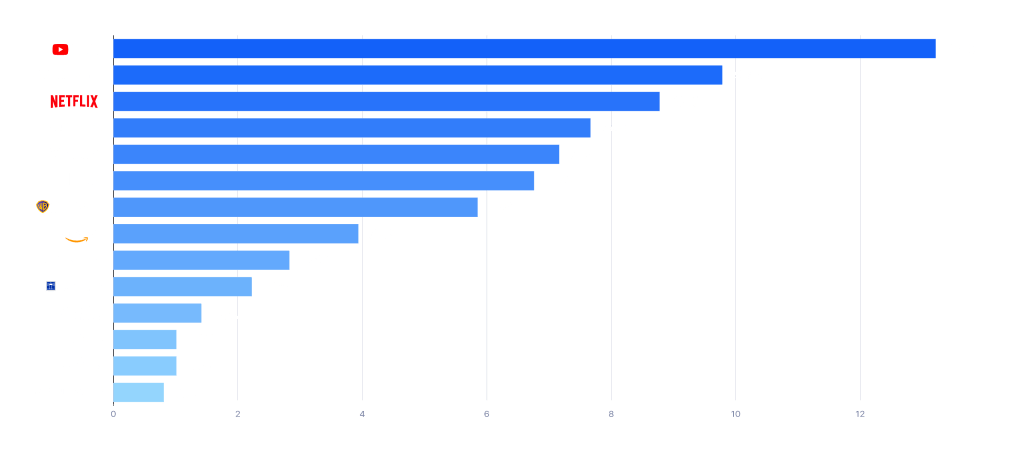
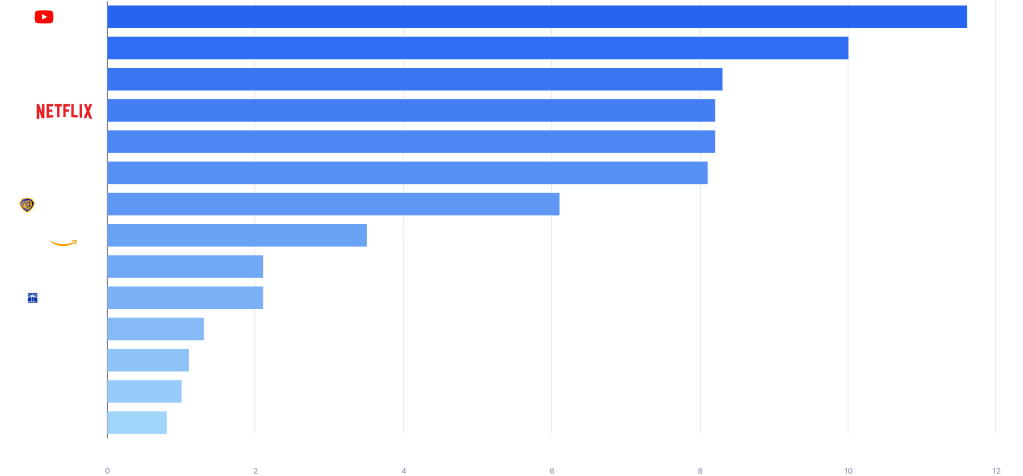
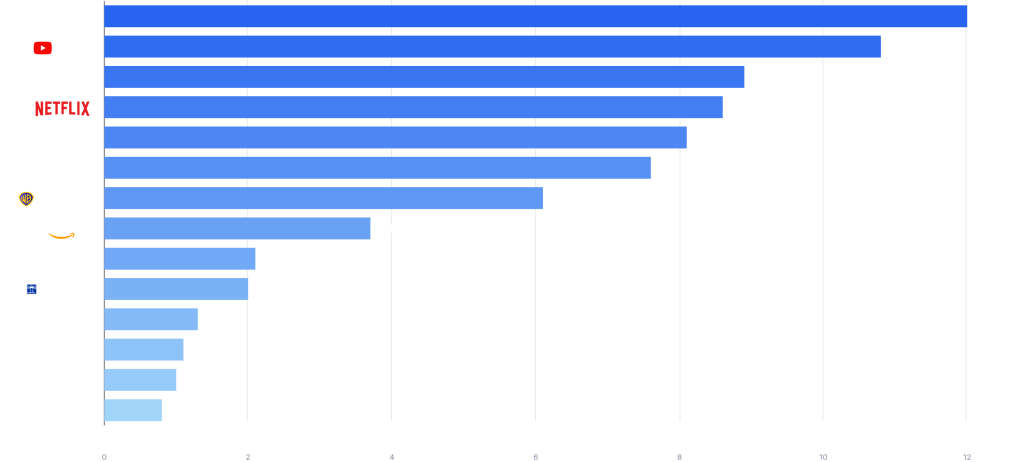
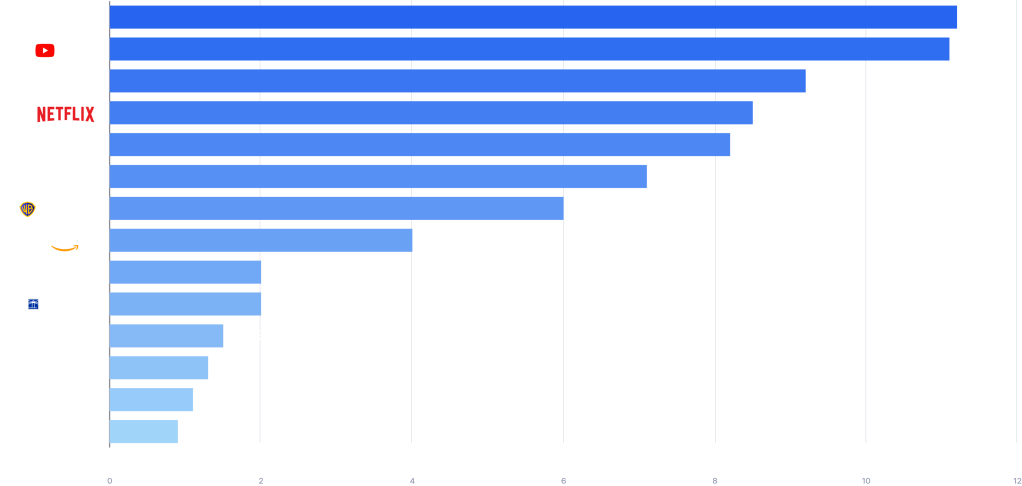
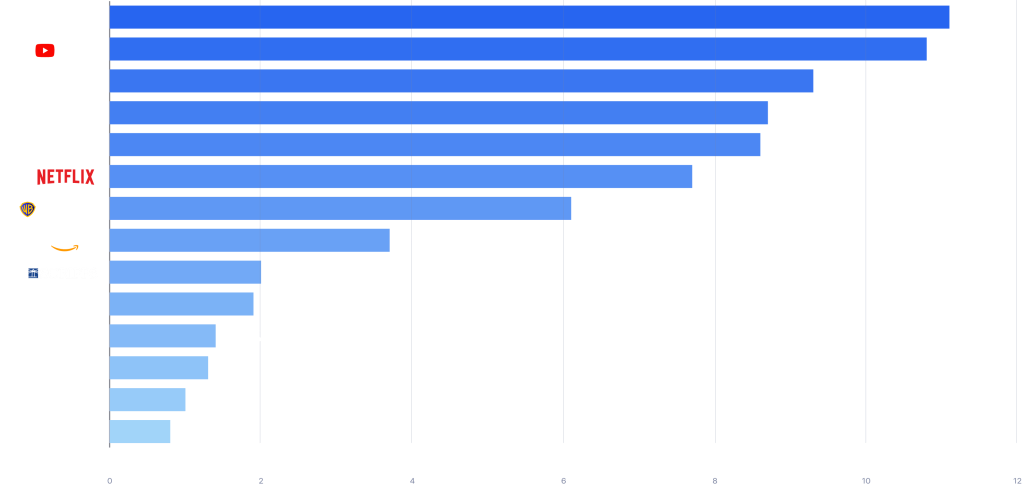
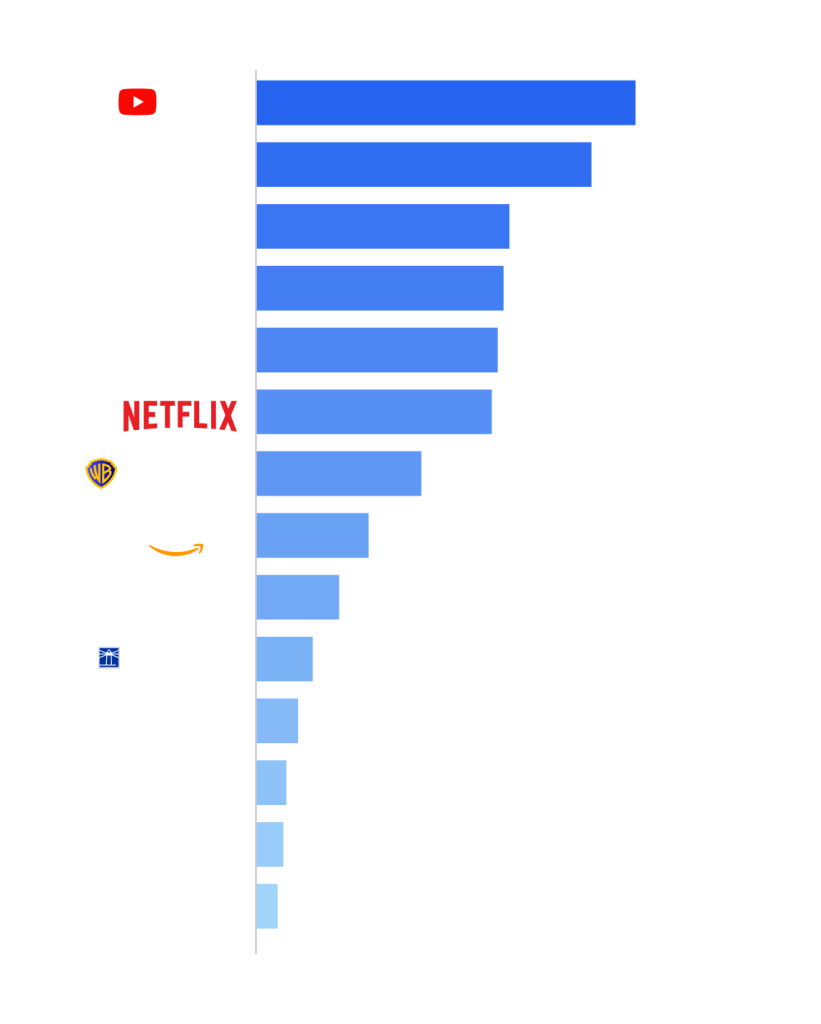
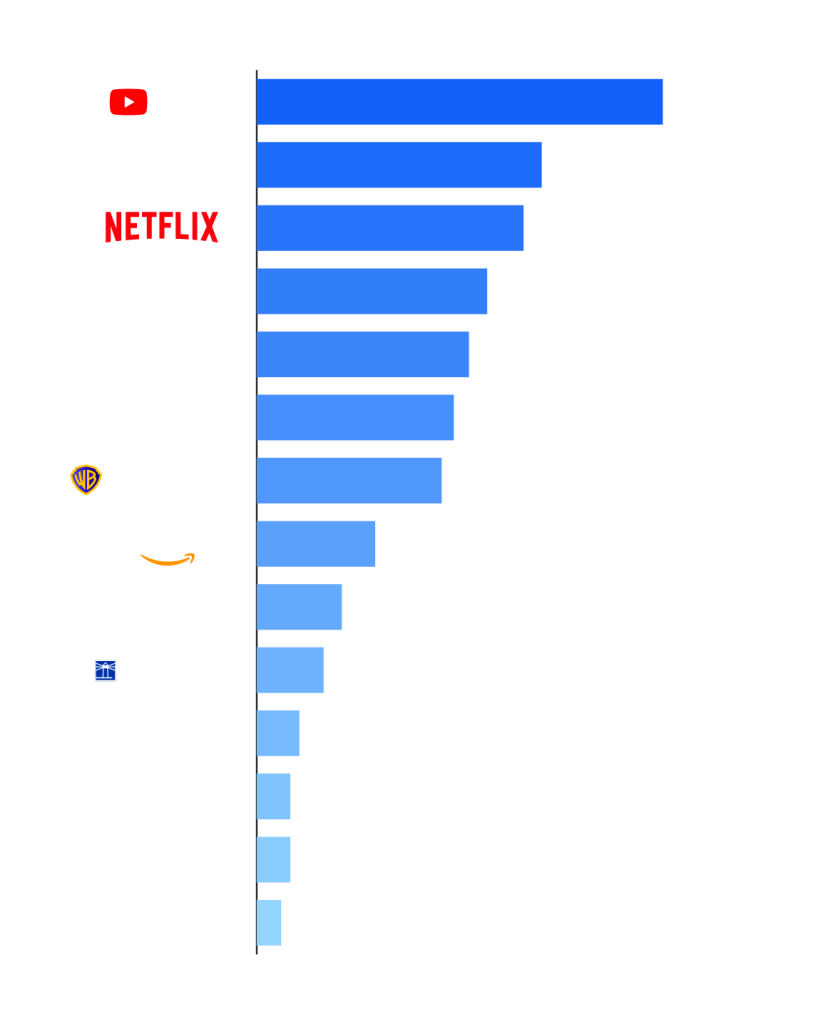
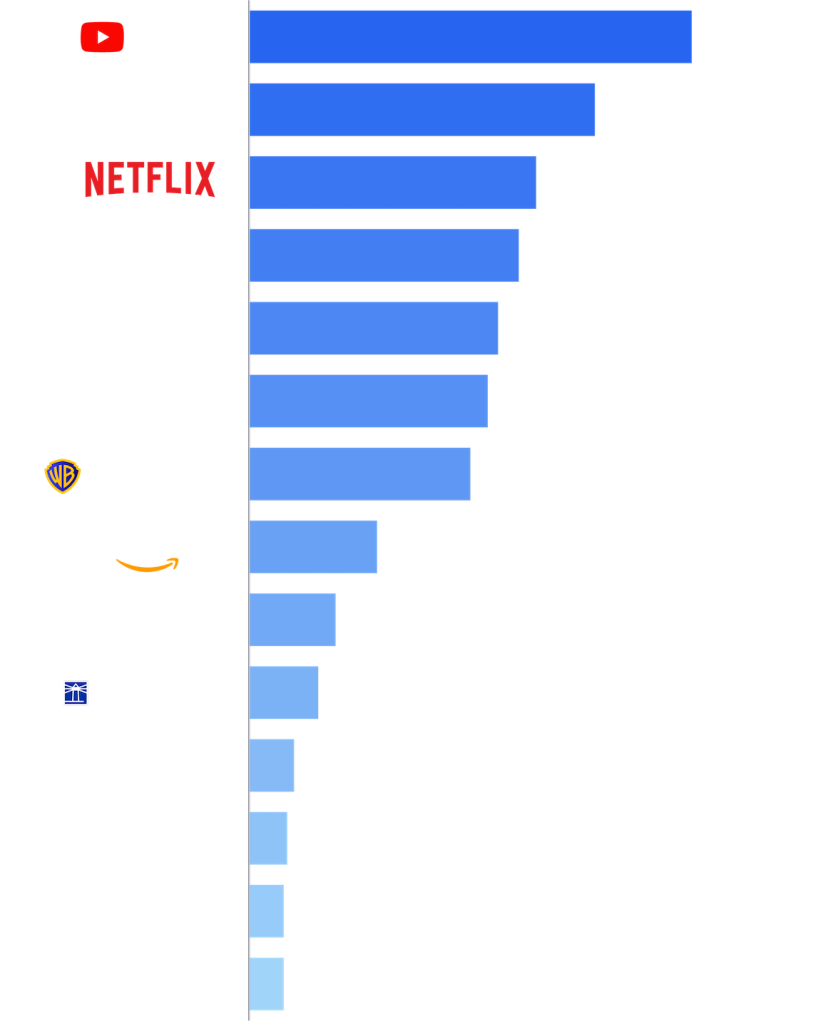
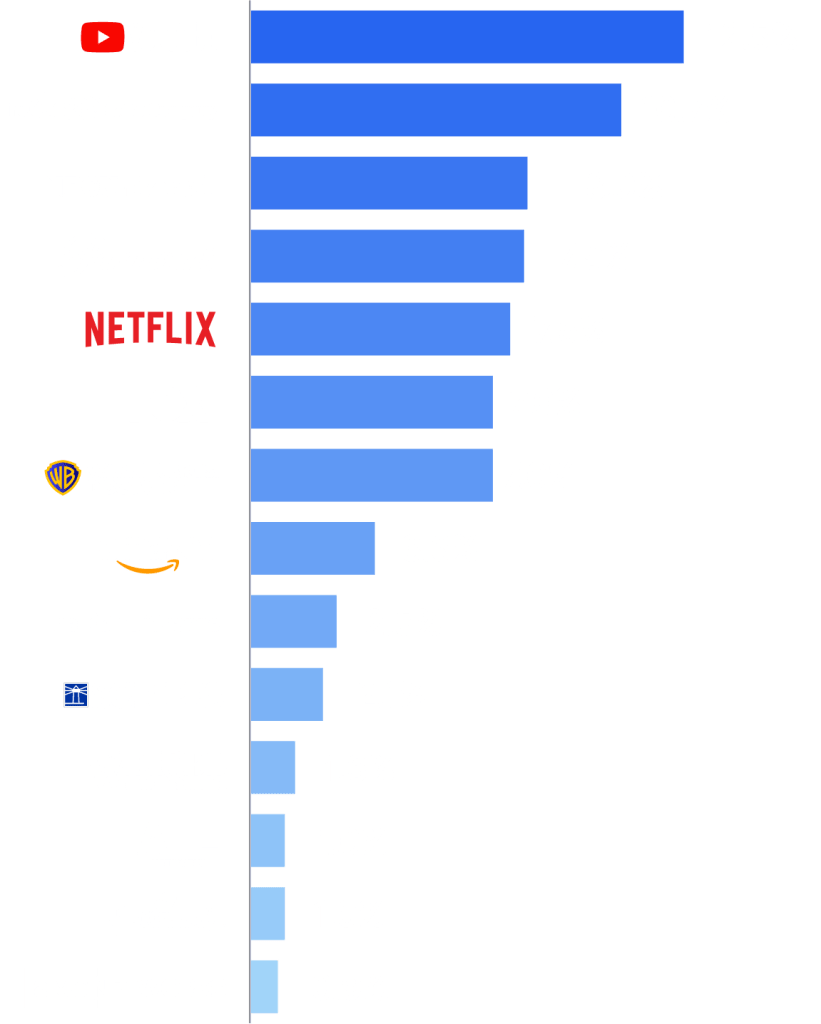
According to the June Media Distributor Gauge, FOX exhibited the largest gain in share of TV (+0.9 pts.) compared to May, and the largest overall viewing increase among all distributors this month (+18%). The World Cup surge boosted viewing on FOX affiliates by 73%, and Fox Sports 1 was up 232%. FOX concluded the month with 7.4% of total TV watch-time and moved up to No. 5 in the Media Distributor Gauge rankings.
NBCU-Versant* represented 9.1% of total TV viewing in June (+0.7 pts.), and its success was a result of two material drivers: NBCU’s Telemundo served as the exclusive home to all Spanish-language World Cup coverage, which drove a 143% monthly viewing increase to its broadcast affiliates in June. Peacock also benefited from Telemundo’s World Cup coverage, as days with games exhibited a 60% audience increase on the platform over those that did not, and viewing from Hispanic audiences increased nearly 200% compared to the prior month.
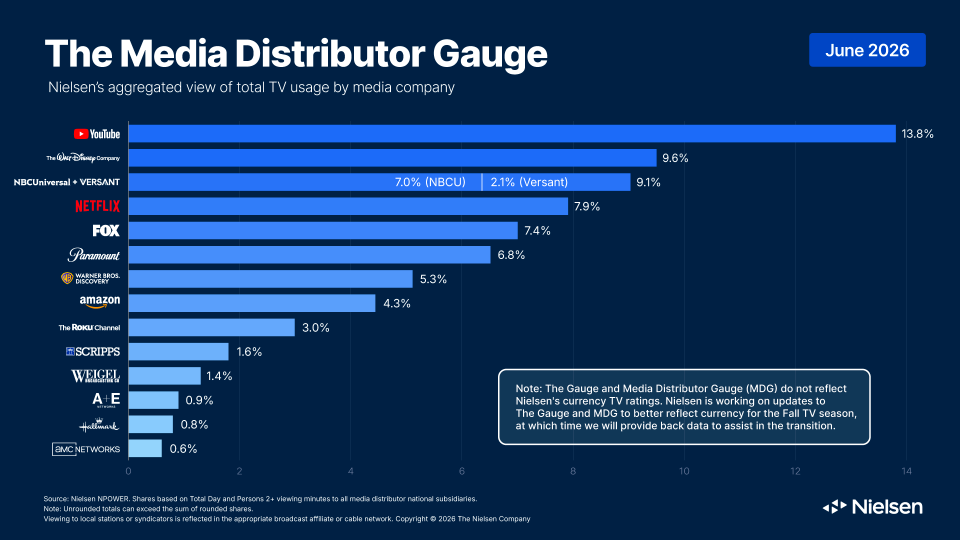
Peacock’s 34% total monthly viewing increase was also due to owning June’s most-streamed title, Love Island USA. The six-night-per-week appointment viewing for the reality dating series generated 6.8 billion minutes across the month. Overall, Peacock gained half a share point to represent 2.3% of total TV viewing in June, its second-best share of TV to date behind February 2026.
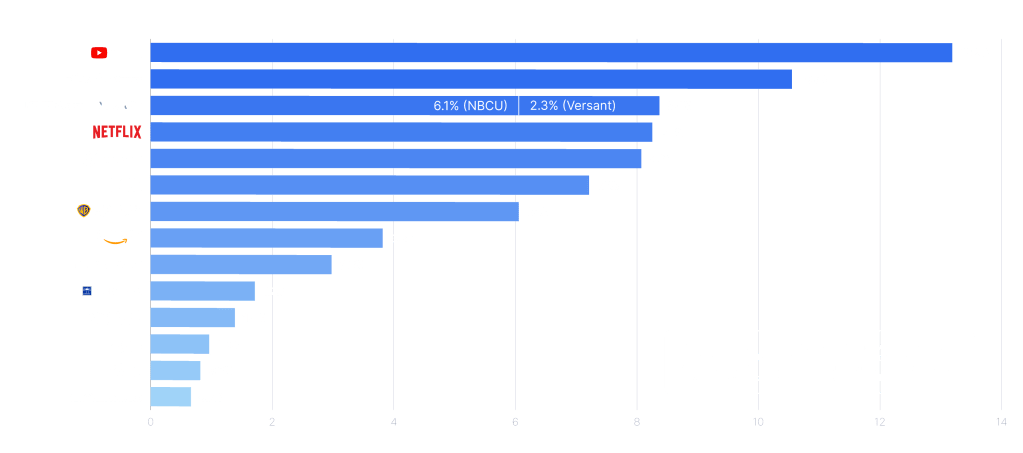
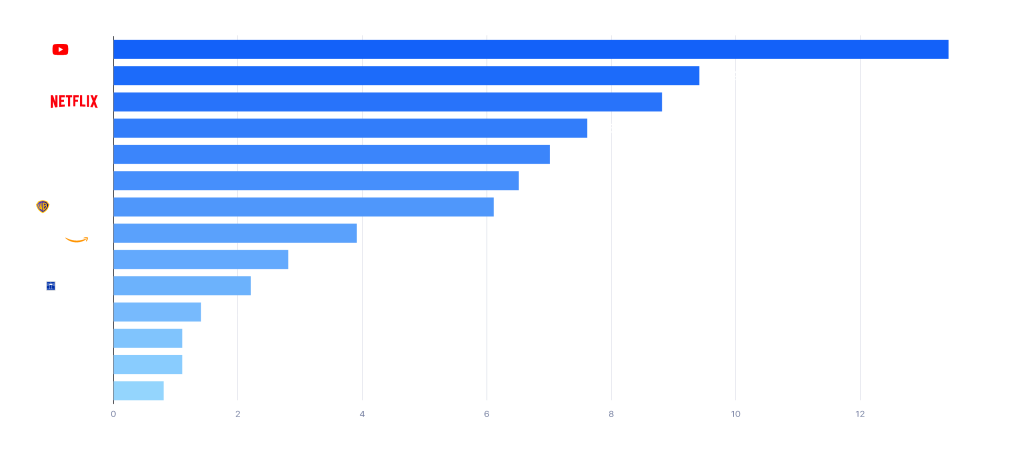
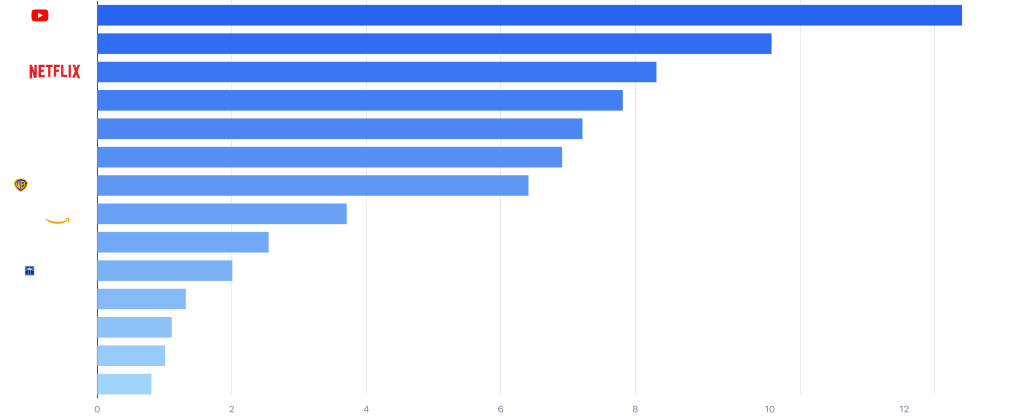
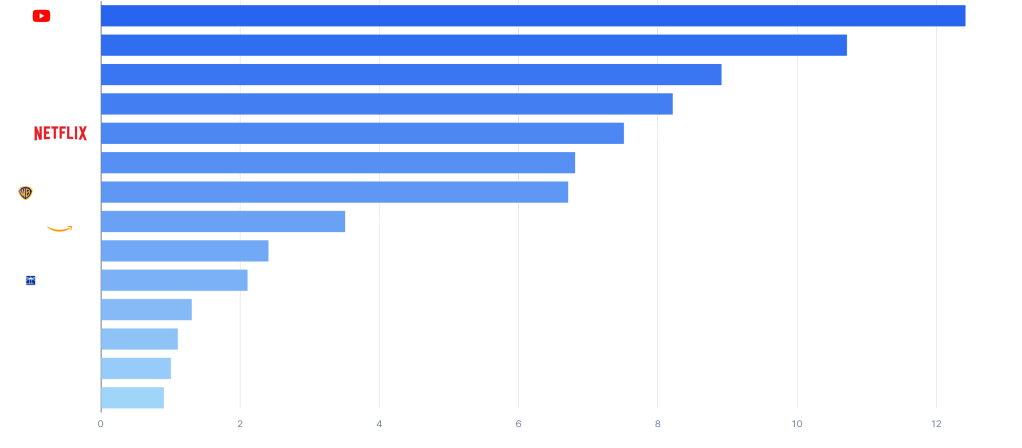
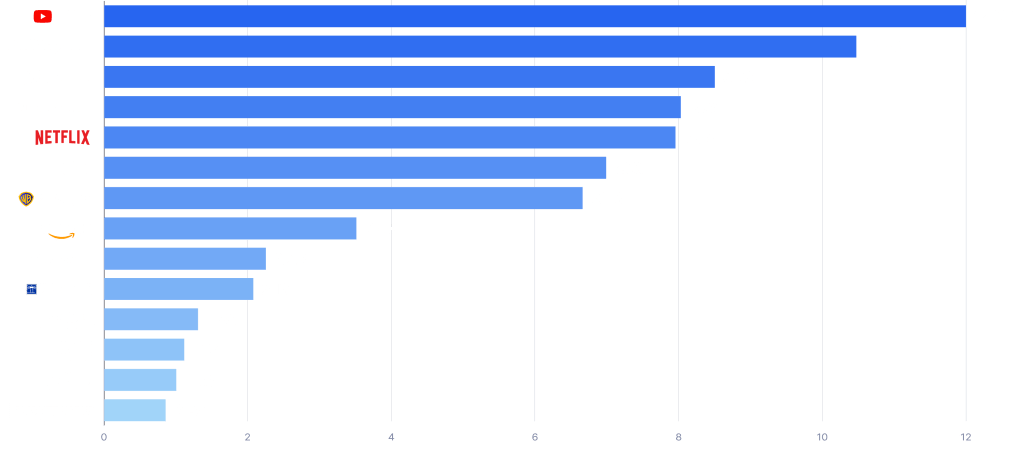
Overall streaming usage was up about 3% compared to May, but due to it being just below the 3.1% increase for total TV usage, the category dropped back 0.1 share point to 48.5% of TV watch-time. In addition to Peacock, several other streamers also saw monthly viewing increases, including YouTube, Netflix, The Roku Channel and Paramount Streaming (Paramount+ and Pluto TV combined), but similar to the overall streaming category, their shares were flat or down slightly. However, YouTube remained in the lead among media distributors with 13.8% of time spent.
Disney held on to the No. 2 spot among media companies with 9.6% of TV. ABC’s coverage of the five-game NBA Finals showdown between the San Antonio Spurs and eventual champion New York Knicks helped drive a 15% viewing bump for ABC affiliates in June. Each game of the series was the most-viewed broadcast telecast on days played, and Games 3, 4 and 5 were the most watched telecasts over the June interval with more than 20 million viewers a piece.
Cable represented 19.5% of television in June (-0.9 pts.) as viewing was down 2% compared to May. This was largely due to the absence of the NBA and NHL playoffs, which led to a 10% monthly decline in cable sports viewership.
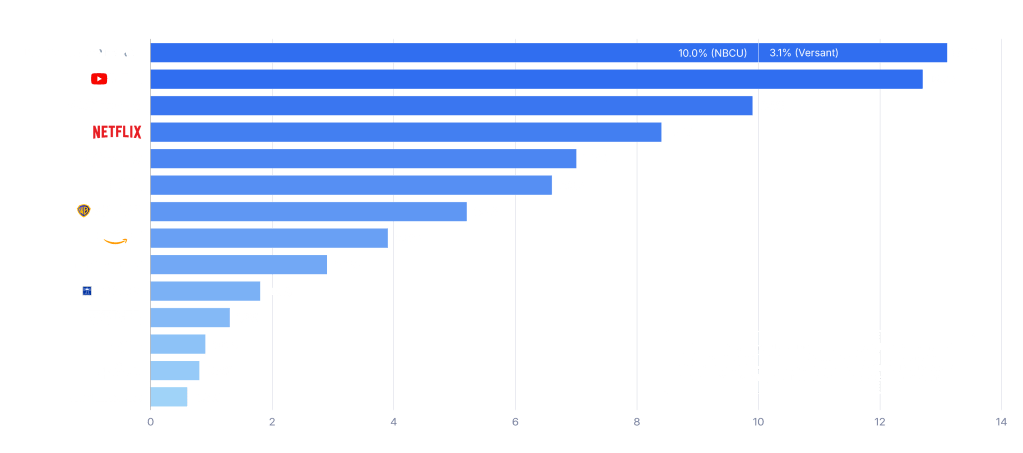
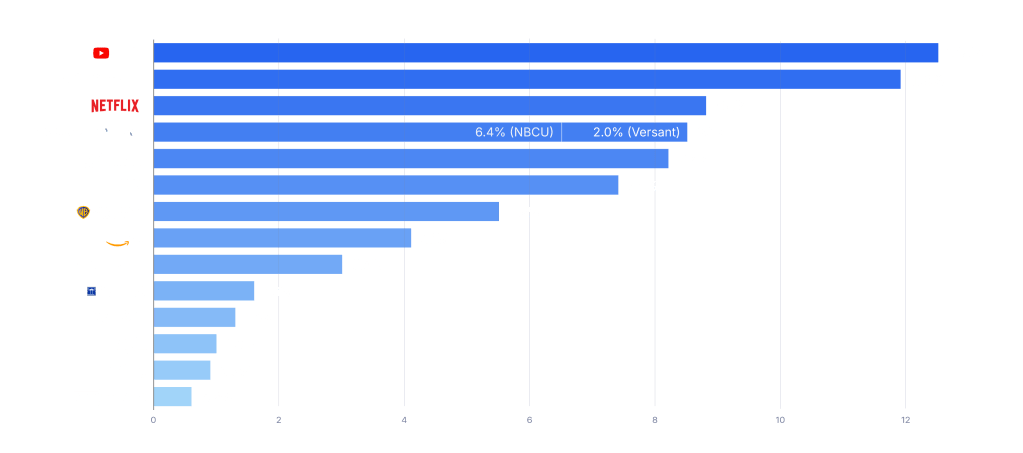
* Due to the fact that advertising sales for Versant are still retained by NBCUniversal, and to preserve data trends and insights in these reports, NBCU and Versant are reported together in the Media Distributor Gauge with each company’s respective share included in the Media Distributor Gauge chart.
The June 2026 interval spanned four weeks, from 06/01/2026 through 06/28/2026. Nielsen reporting follows the broadcast calendar, with weekly intervals beginning on Monday.



NOTE: The Gauge and Media Distributor Gauge (MDG) reports are representative of total television viewing, including both ad-supported and non-ad-supported viewing. The Gauge and MDG do not reflect Nielsen’s currency TV ratings that inform advertising sales. Methodological updates to The Gauge and MDG reports will be implemented this fall to include various enhancements to Nielsen’s currency measurement.
About Nielsen
Nielsen is a global leader in audience measurement, data and analytics. Through our understanding of people and their behaviors across all channels and platforms, we empower our clients with independent and actionable intelligence so they can connect and engage with their global audiences—now and into the future. Learn more at www.nielsen.com and connect with us on social media (X, LinkedIn, YouTube, Facebook and Instagram).
Press Contact
Lauren Pabst
lauren.pabst@nielsen.com