The media ecosystem is changing—70.6% of U.S. TV homes have a smart TV, up from 62.3% two years ago1. With widespread connected TV (CTV) adoption2 and increasing high-speed internet availability, new ways of watching have introduced new (and bigger) data sets. Innovations in audience measurement are critical to keep pace with audiences’ evolving media habits. They also present opportunities for both buyers and sellers to better understand how content—and ads—are performing.
At Nielsen, we’re committed to innovating on our industry-accepted TV audience measurement to ensure the media industry can trade with confidence. To that end, we’ve invested a decade of research in integrating big data sets into our methodologies in innovative ways that also ensure continuity with our currency measurement. For the ‘24-’25 TV season in the U.S., we have enhanced our Big Data + Panel stream to include Comcast data (in addition to DISH, DirecTV, Roku and Vizio).
Learn how we’re balancing the need for innovation and continuity in audience measurement.
Read more>
Our big data set includes 45 million big data households and 75 million devices, which rivals that of any other measurement provider. By combining (and validating) our big data with our gold-standard panel of approximately 42,000 U.S. homes (including 101,000+ real people), we’re able to leverage the scale and coverage of big data with the granularity and representation of our industry-leading panel for deeper audience insights.
To help the industry navigate the transition, both our Big Data + Panel and Panel measurement data will be available for the coming TV season. And with two views of the U.S. audience for every Nielsen-measured telecast in 2023, we inevitably see some differences. Whenever a measurement sample changes, audience estimates will also change. They may go up or down depending on the individual network, program or telecast, but larger sample sizes facilitate more comprehensive measurement. To help the industry better plan and negotiate around this year’s TV season with Big Data + Panel, we’ve compared average overall TV usage, as well as for programs and genres, for the past year.
How does total TV usage change?
With Big Data + Panel, the total U.S. households using television in 2023 increased slightly across most age groups compared with TV panel data alone. When we break TV usage out by race and ethnicity, we see similar trends. The numbers of Hispanic and Black households using television also generally increased across each age group with Big Data + Panel. Differences in the data sets vary by age groups across all demographics, but each of the three segments showed the most significant increase among older age groups (people 65+).
In addition to understanding how audiences of different age, race and ethnicity shift with Big Data + Panel, understanding changes throughout the day is also important for media planning. When we look at viewing throughout the day, TV usage generally increased slightly during each part of the day. Overnight hours had the smallest increase.
With 45 million big data households and 75 million devices, our Big Data + Panel approach expands coverage and scale. Greater coverage and scale allow for the measurement of even more people and programs. For both buyers and sellers, this opens up more opportunities to understand and engage with viewers. Audiences today are eager to see themselves in both the content and ads on TV, especially Black and Hispanic audiences. Understanding reach across segments and dayparts can help you connect audiences with the right content (and ads) at the right time.
While the big data brings scale, combining it with our panel data plays a key role in unlocking these audience insights. Our gold-standard panel allows media buyers and sellers to go beyond households to understand the people consuming media. They’re able to ask deeper questions, such as: Who lives in the home? How old are they? What race and ethnicity do they identify as? Who is watching the television at a given point in time? As a result, our Big Data + Panel data stream is able to provide demographic, geographic, over-the-air and broadband only household information, as well as out-of-home (OOH) viewing.
How do program ratings change?
While overall TV usage overall generally increased across age groups, ratings across individual networks, programs and telecasts vary. Averaging the more than 111,000 programs across broadcast, cable and syndication in 2023, most program ratings saw little to no change or positive change. In fact, among people 2+, 87.5% of programs saw little to no change or positive change in ratings. Similar to overall TV usage, program ratings do differ across age groups, with older demographics seeing more change–both positive and negative.
To understand how the methodology changes impacted different programs, we also looked at programming genres. Across broadcast, cable and syndication, the average monthly percent change between Big Data + Panel and TV panel for people 2+ increased for almost all genres.
With the addition of bigger datasets, our measurement sample does change, and some of the program (and genre) rating changes may reflect these differences in data. However, program ratings also genuinely fluctuate–just as people’s behaviors do. A program’s audience will fluctuate from telecast to telecast, and these averages will reflect some of that natural variability.
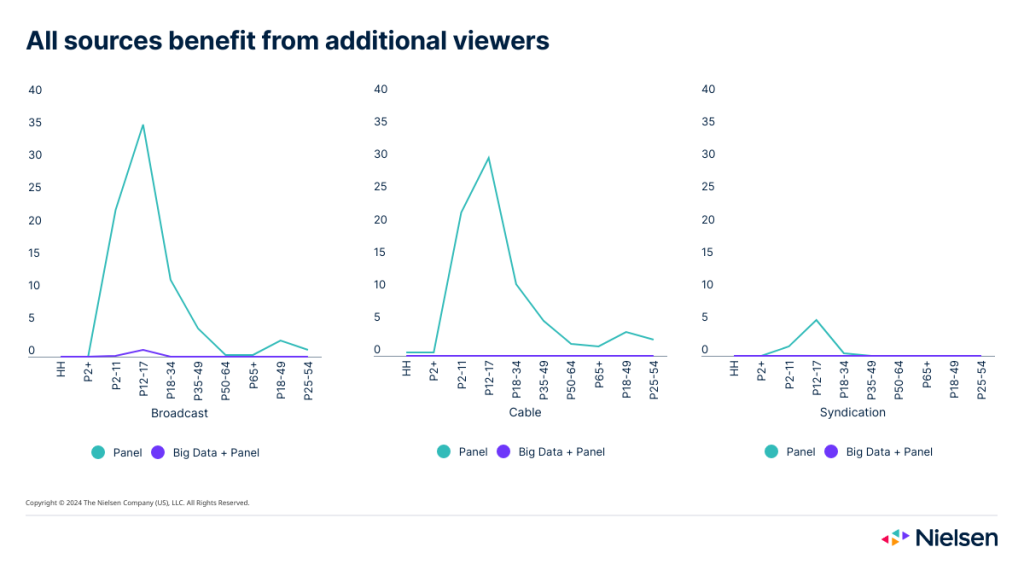
One of the key benefits of adding big data to our panel measurement is enhanced granularity and measurement stability. With deeper data sets comes increasing viewing estimate stability, reducing sampling errors, and reducing the number of programs with no reported viewing (zero ratings). Across broadcast, cable and syndication, the percentage of zero audience programs decreases with additional viewers.
The benefits of Big Data + Panel
Big data does not eliminate variability in the data and we don’t expect it to, as there is real variability in the population. However, our Big Data + Panel approach innovates on our already gold-standard panel data to deliver sensitive and stable ratings overall, resulting in the near elimination of zero ratings and reductions in telecast variability. For publishers, the increased granularity and stability of the Big Data + Panel data stream means more of the national TV inventory is monetizable: increasing from 88% to 99.9%.
For advertisers and agencies, that means more opportunities to connect with audiences. By marrying the scale of big data with person-level information from our panel, we’re able to provide more advanced targeting to unlock the ability to capitalize on linear addressable capabilities, as well as advanced audience segments.
Ultimately, Nielsen believes that a single currency (supported by secondary metrics) results in a more efficient marketplace. But during this period of transition, having both Big Data + Panel and Panel measurement available will help the industry navigate this change and trade with confidence.
To learn more about how Nielsen is moving audience measurement forward, explore Nielsen ONE.
Sources
1Nielsen National TV Panel, October 2023.
2CTV refers to any television that is connected to the internet. The most common use of the internet connection is to stream video content.
