There is no mistaking the impact of connectivity on how audiences are watching TV. In just the past five years, the number of households in the U.S. that get their TV content from an internet connection has increased by more than 210%1. The allure of an internet’s worth of content notwithstanding, a smaller, yet consistent, portion of TV homes continue to thrive on the over-the-air (OTA) broadcast programming they access for free using digital antennas—even when more than 70% of homes now have at least one smart TV2.
Nielsen’s 2024 Upfronts/NewFronts Guide revealed that, as of November 2023, more than 18% of U.S. TV households had at least one TV set enabled to receive free, broadcast programming. Given the many content options available to audiences, however, few homes rely solely on their digital antennas for TV content. Most complement their OTA access with content they can access from other sources. Sixty percent, for example, subscribe to a streaming video-on-demand service. The same is true of households that have cable or satellite services: In fact, nearly 4% have at least one OTA-enabled TV set.
While the way in which audiences access TV content continues to evolve, the concentration of OTA homes has remained consistent over the past five years. OTA homes represented 14.5% of U.S. TV households3 in third-quarter 2023.
The consistency of OTA programming access, inclusive of virtual multichannel video programming distributors (vMVPDs; e.g., Hulu Live, YouTube TV, Sling TV) usage, highlights TV audiences’ ongoing engagement with traditional, linear programming. In fact, approximately 92% of TV households, regardless of classification, watched some form of linear programming between October 2022 and October 2023.
Approximately 92% of TV homes watch some form of linear programming
In addition to highlighting the consistent appeal of traditional broadcast programming, the steadfast portion of homes that access this content with digital antennas is a critical audience measurement consideration, especially as big data gains momentum as a measurement source amid rising connected TV (CTV)4 usage.
With CTV usage accounting for just over 32% of TV usage among adults 18 and older5, it makes sense that companies are looking to leverage the data from smart TVs and set-top-boxes from multichannel video programming distributors (MVPDs; e.g., DirecTV, Cox, Comcast Xfinity, DISH). We know that these data sources can advance the science of audience measurement, but they don’t capture OTA viewing.
Big data can advance the science of audience measurement, but it doesn’t capture OTA viewing
According to Nielsen’s TV universe estimates for 2023-24, the U.S. has 125 million TV households, up 1% from the previous year. That means that just under 97% of U.S. households have at least one TV that is used to watch programming. These households are home to almost 315.3 million people.
Nearly 23 million U.S. homes access free TV programming using digital antennas
Within the TV household universe, 18.125 million are OTA households, and an additional 4.625 million are cable and satellite TV homes that also have OTA-capable TV sets. In total, 22.750 million households access TV content through an OTA antenna—a device that falls outside the scope of big data collection.
The consistent and significant engagement with linear programming is notable for two reasons:
- The vast majority of TV homes continue to watch traditional, ad-supported programming.
- Big data sources alone can’t provide insight into the viewing behaviors of the millions of viewers who watch TV using a digital antenna.
Outside of the national average, OTA usage plays a much larger role in select cities. In Houston, for example, more than 27% of TV homes have at least one TV set enabled to receive free, broadcast programming, with nearly 24% using their antennas as the primary means of watching TV. The percentage of OTA use even surpasses 30% in select DMAs, with Oklahoma City topping the list: 37.3% of TV homes in this market have at least one OTA-enabled TV set.
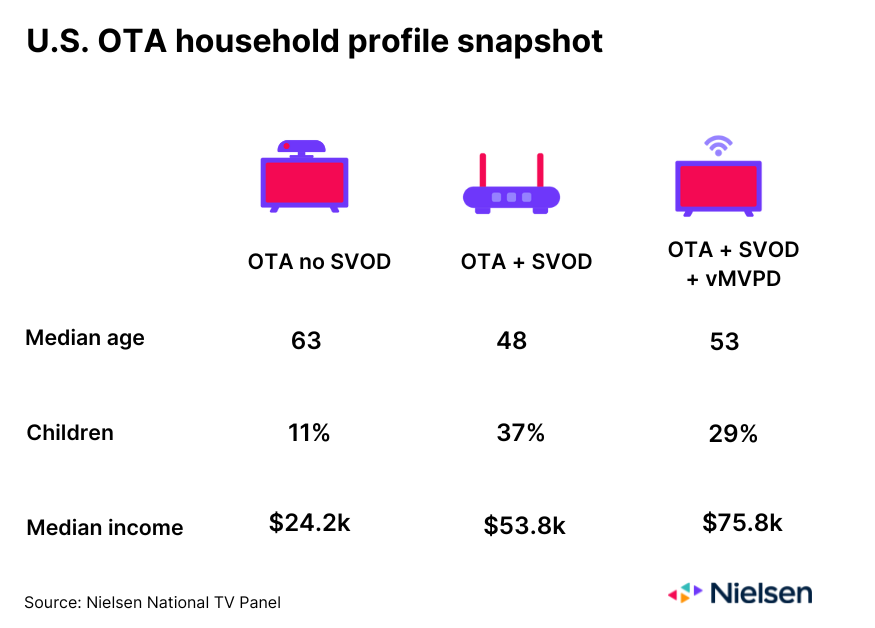
Combined with person-level demographic information from Nielsen’s National TV panel, OTA audience data provides advertisers and agencies with insight that’s out of reach of big data. Nearly 60% of OTA households that don’t subscribe to a subscription video on demand (SVOD) service, for example, are households of one person, while 45% of OTA households that subscribe to an SVOD service but don’t use a vMVPD are home to three or more people. From an income perspective, however, OTA households that subscribe to an SVOD service and use a vMVPD are the biggest earners.
Increasing connectivity among audiences continues to play a significant role in how viewers access TV content, but free OTA broadcast programming remains a staple for nearly 20% of U.S. TV households. From a value perspective, advertisers and agencies need insight into the nearly 23 million viewers who lean into this programming—programming that falls outside the realm of what big data captures. As audience measurement evolves to include data from smart TVs and cable boxes, it will be critical that people, not big data, remain the center of the equation.
Learn more about the power of big data and panel measurement here.
Sources
1Nielsen National TV Panel; September 2019 vs. September 2023. This percentage reflects the increase in homes that stream TV content from the internet and/or access TV content through a vMVPD.
2Nielsen National TV Panel; October 2023
3This percentage includes homes that may have an vMVPD. Nielsen plans to reclassify homes with a vMVPD as Cable Plus homes in 2024.
4CTV refers to any television that accesses content from the internet. The most common use case is to stream video content.
5Nielsen National TV Panel; Q2 2023