Netflix Viewing Up 13.5% vs. May, Represents 42% of Monthly Gain for Streaming
Peacock Notches 13.4% Increase, Boosted by New Season of ‘Love Island USA’
TV Usage by Kids and Teens Climbs 27% Thanks to Summer Break From School
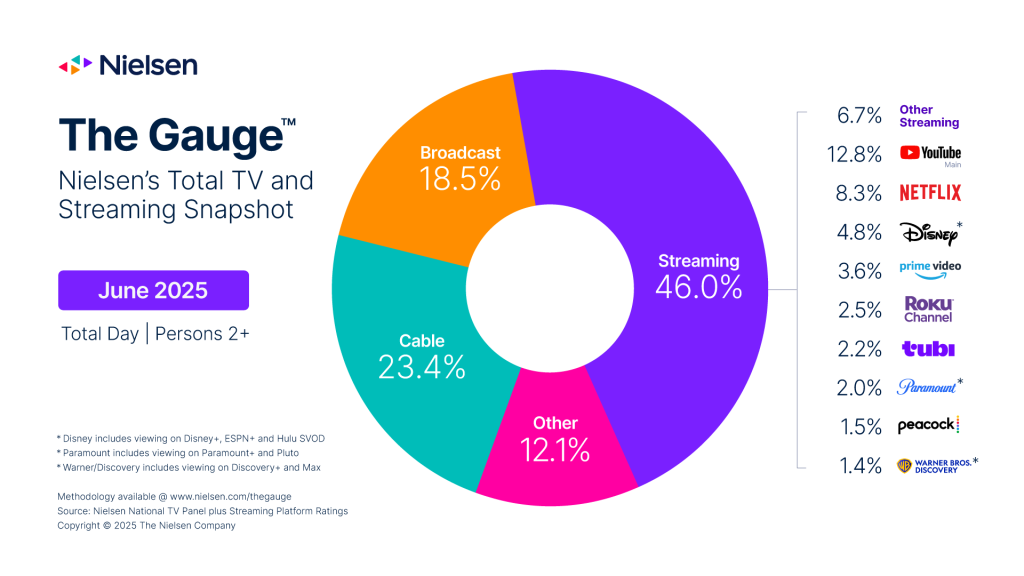
NEW YORK – July 15, 2025 – In Nielsen’s 50th monthly report of The Gauge™, the media industry’s leading snapshot of total TV and streaming consumption, streaming viewership surged again in June to represent 46.0% of television usage. Time spent streaming was up 5.4% over last month, which was primarily driven by both a standout month for Netflix, and a seasonal influx in viewing from school-aged audiences.
Netflix recorded the largest monthly uptick among streaming platforms in June, posting a 13.5% viewing increase over May and adding 0.8 share points to command 8.3% of TV. In fact, Netflix’s performance was so strong, it accounted for 42% of streaming’s total monthly gain. The considerable upswing for Netflix was powered by a slate of highly successful content, including its original series Ginny & Georgia, which was the most-streamed title of the month with 8.7 billion viewing minutes. The “Netflix Effect” was also in full view with the immediate popularity of acquired series Animal Kingdom and Blindspot, which earned the second and third most-streamed titles in June and combined for 11.4 billion viewing minutes (5.71B and 5.69B, respectively). Finally, Netflix rounded out the month with the release of the third season of Squid Game, which generated nearly a billion viewing minutes—per day—across the series in the final three days of the June interval.
Peacock was a close second to Netflix from a monthly increase perspective, notching a 13.4% usage uptick. Peacock’s increase was driven by the new season of its original series Love Island USA, which garnered 4.4 billion viewing minutes and was the fourth most-streamed title of the month. Peacock ultimately gained a tenth of a share point to finish with 1.5% of TV in June, up 0.3 points compared to June 2024.
Kids and teens were the other main driver of streaming’s share shift, as well as for the overall increase in total television usage, which was up 3% over May. With more time to spend in front of the TV, total usage among 6-17 year-olds was up 27% versus last month, and streaming accounted for two-thirds (66%) of their total time spent with TV in June. Not coincidentally, Netflix and Peacock both saw the largest month over month increases from the 6-17 year old group, with viewing from that cohort jumping 32% and 37%, respectively, versus May.
Also notable among this school-aged demographic was its contribution to the Other category. While “Other” contains a variety of sources, the main contributions come from video game console usage and set top box usage. The Other category was up 14% overall versus May, but among 6-17 year-olds, the increase was much more significant, capturing a 41% bump.
Though broadcast and cable each exhibited declines in overall viewing in June, there were a few bright spots. For broadcast, the NBA Finals on ABC represented the top seven telecasts of the month and helped lift broadcast sports viewership by 17% compared to May. In addition to the seven finals games, ABC took each of the top 12 telecasts in June, including the NBA Trophy Presentation and ABC World News Tonight. Cable also benefited from NBA viewership, as the NBA Conference Finals on ESPN and TNT ranked as the top two cable telecasts. A busy news cycle also drove cable news viewing up 12% versus May, and feature film viewing also trended upward. Cable also benefitted from special programming, including the Army 250 Parade on FOX News Channel which ranked fifth among cable programs with 2.8 million viewers, and Goodnight and Good Luck on CNN, which was seventh among cable programs in June with 2.4 million viewers.
The summer lull in traditional television viewing was evident this month, however, and the combined share of broadcast and cable fell from 44.2% of TV in May to 41.9% in June. On the whole, broadcast viewing was down 5% to represent 18.5% of total TV, marking the first time the category has fallen below a 20.0% share. Cable viewing was fairly flat compared to May, but the category still lost 0.7 share points due to the larger increase in overall TV usage and finished June with 23.4% of TV.
The June 2025 interval included dates 05/26/2025 through 06/29/2025. Nielsen reporting follows the broadcast calendar with measurement weeks that run Monday through Sunday.
About The Gauge™
The Gauge™ is Nielsen’s monthly snapshot of total broadcast, cable and streaming consumption that occurs through a television screen, providing the industry with a holistic look at what audiences are watching. The Gauge was expanded in April 2024 to include The Media Distributor Gauge, which reflects total viewing by media distributor across these categories. Read more about The Gauge methodology and FAQs.
About Nielsen
Nielsen is a global leader in audience measurement, data and analytics. Through our understanding of people and their behaviors across all channels and platforms, we empower our clients with independent and actionable intelligence so they can connect and engage with their global audiences—now and into the future. Learn more at www.nielsen.com and connect with us on social media (X, LinkedIn, YouTube, Facebook and Instagram).
Press Contact
Lauren Pabst
