Broadcast Builds On Lead Over Cable, Driven by Football and Drama Programming Gains
NFL’s Halo Effect Extends to Streaming as Games Drive Increased Engagement on Amazon Prime Video, Paramount+ and Peacock
Broadcast Dramas Jump 28% as Top Shows on CBS, ABC and NBC Fuel Gains
NEW YORK – November 18, 2025 – Television viewership continued its seasonal momentum into October, with shifts largely attributable to the NFL, according to Nielsen’s monthly report of The Gauge™, the media industry’s leading snapshot of total TV and streaming consumption. The NFL is simultaneously driving a massive resurgence in broadcast viewing (up 4.3% from last month)and propelling gains for key streaming services, distinguishing itself as the irrefutable multiplatform catalyst of the fall TV season.
The impact of NFL coverage in October was most apparent when isolating viewership by day: Sundays exhibited the largest viewing shift across categories for the month, as broadcast averaged a 5.3-point gain to climb from an average of 22.0% of TV Monday through Saturday, to 27.3% of TV on Sundays. By contrast, cable and streaming viewership experienced the opposite effect, with watch-time up slightly Monday-Saturday and noticeably lower on Sundays.
| October Total | Monday-Saturday | Sunday Only | Share Difference | |
|---|---|---|---|---|
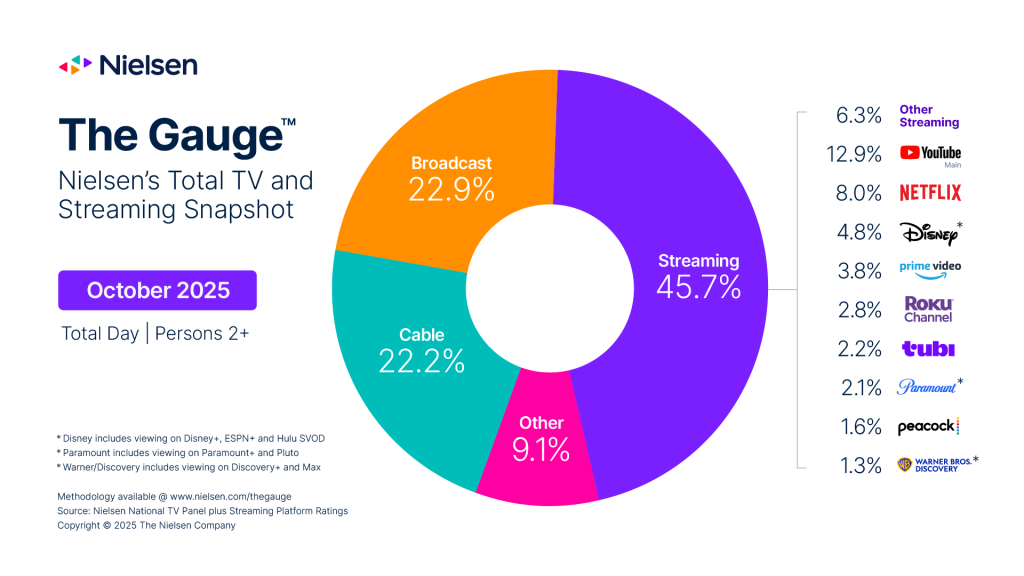
| Streaming | 45.7% | 45.9% | 44.6% | -1.3 |
| Broadcast | 22.9% | 22.0% | 27.3% | 5.3 |
| Cable | 22.2% | 22.7% | 20.0% | -2.7 |
Several streaming services also benefited from NFL-driven increases in October, both on game days and overall:
- Peacock exhibited a 19% monthly viewing uptick in October and represented 1.6% of TV. Peacock’s share on Sundays, however, averaged 2.0% of total TV.
- Paramount+ viewership was up 8% in total versus last month, and the streamer’s average share of TV increased from 1.2% during Monday-Saturday, to 1.6% on Sundays.
- Amazon Prime Video, home of NFL Thursday Night Football, gained 3-points against its monthly average on game days, jumping to 6.4% of TV on Thursdays in October.
Broadcast led all TV categories with a 4.3% monthly viewing gain in October, which resulted in 0.6 additional share points and 22.9% of television—building on its lead over cable and marking its largest share of TV since November 2024 (23.7%). Despite a robust month, broadcast sports viewership was down compared to September (-6.4%) but still accounted for nearly a third of all broadcast viewing. NFL games on CBS, FOX and NBC claimed the top three overall program rankings with over 20 million viewers apiece (L+7). The fall TV season continued to unfold in October as well, as broadcast drama viewership saw a 28% increase over September led by Tracker, Matlock and NCIS on CBS, High Potential on ABC, and Chicago Fire on NBC, to represent the largest monthly gain within the category.
Streaming viewership was up 2.4% month-over-month, outpacing the increase in overall TV usage (+1.3%) to gain a half-point and represent 45.7% of TV watch-time in October. This growth was primarily fueled by the aforementioned surge in football viewing across key streaming platforms, and while most non-NFL streamers saw decreases on game days, Netflix bucked the trend and grew its share of TV on Sundays. Netflix netted out with 8.0% of TV in October, but on Sundays specifically, its share climbed to 8.2% of TV. This was partially on the strength of its original series Monster: The Ed Gein Story, which was the most-streamed title of the month with 5.4 billion minutes viewed.
Cable watch-time in October tracked closely with overall usage (+1.2%), but the category’s share of TV slipped 0.1-point due to rounding to finish with 22.2% of total TV. Cable sports viewership increased nearly 50% versus September and represented 14% of the category’s viewing total. Feature films were a bright spot for cable this month, exhibiting a 7% monthly increase as viewers sought out their favorite spooky movies amid the Halloween season. Cable news continued to lead cable viewing and owned nearly a quarter of the category’s share despite a 3% drop from last month.
The October 2025 interval spanned four weeks, from 09/29/2025 through 10/26/2025. Nielsen reporting follows the broadcast calendar, with weekly intervals beginning on Monday.
About The Gauge™
The Gauge™ is Nielsen’s monthly snapshot of total broadcast, cable and streaming consumption that occurs through a television screen, providing the industry with a holistic look at what audiences are watching. The Gauge was expanded in April 2024 to include The Media Distributor Gauge, which reflects total viewing by media distributor across these categories. Read more about The Gauge methodology and FAQs.
About Nielsen
Nielsen is a global leader in audience measurement, data and analytics. Through our understanding of people and their behaviors across all channels and platforms, we empower our clients with independent and actionable intelligence so they can connect and engage with their global audiences—now and into the future. Learn more at www.nielsen.com and connect with us on social media (X, LinkedIn, YouTube, Facebook and Instagram).
Press Contact
Lauren Pabst
lauren.pabst@nielsen.com
