October brings a larger audience in front of TV screens. The cooler autumn weather and the continuation of new programming schedules brought increases in both traditional television viewership and the streaming segment.
The total time spent in front of a TV screen increased by almost 13 minutes compared to September 2025, reaching 3 hours and 51 minutes. This result is also 8 minutes higher than in October 2024 (3 hours and 43 minutes).
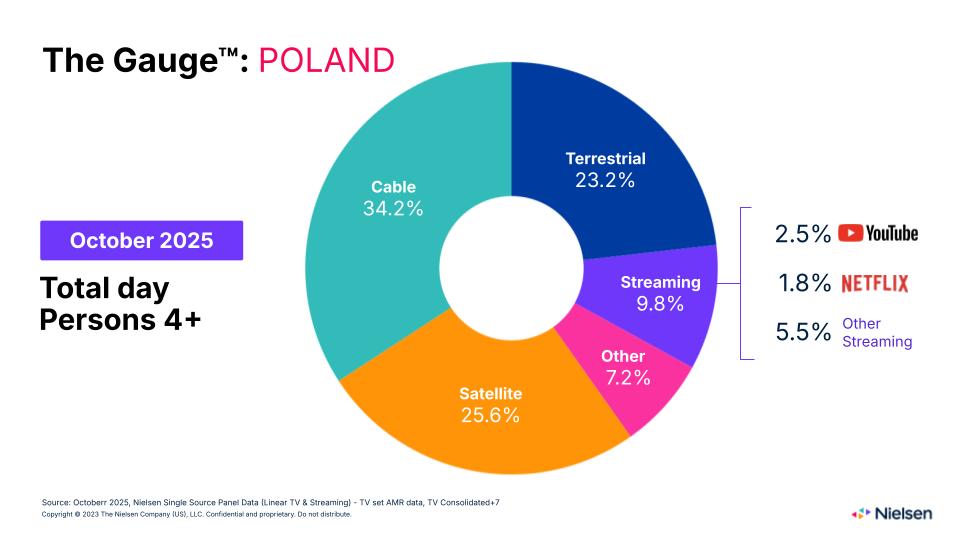
Streaming strongly recovered in October from the losses of the previous month. The share of streaming in total TV screen viewership increased by 0.7 p. p., reaching 9.8% (compared to 9.1% in September). Significant changes were observed among streaming platforms. YouTube’s share grew to 2.5% (0.3 p. p. more than in September), while Netflix’s share recorded a decrease, falling to 1.8% (0.2% less than in September).
About The Gauge™
The Gauge™ was created to provide the media industry with a monthly analysis of television usage across key television delivery platforms. Nielsen published its first edition of The Gauge™ in the U.S. in May 2021.
About The Gauge™ Methodology
The data comes from Nielsen’s single-source panel consisting of 3,500 households and almost 9,700 panelists. The Gauge™: Poland is based on monthly AMR (Average Minute Rating) audience share data. The data is presented for people over 4 years old, broken down into cable, satellite, terrestrial television (both linear and shifted in time up to 7 days), and viewership from streaming (live streaming viewership of TV stations on OTT platforms is classified as streaming viewership). The “Other” category includes views of unrecognized content.
Nielsen Poland created this iteration of The Gauge™ using methodologies comparisons.
