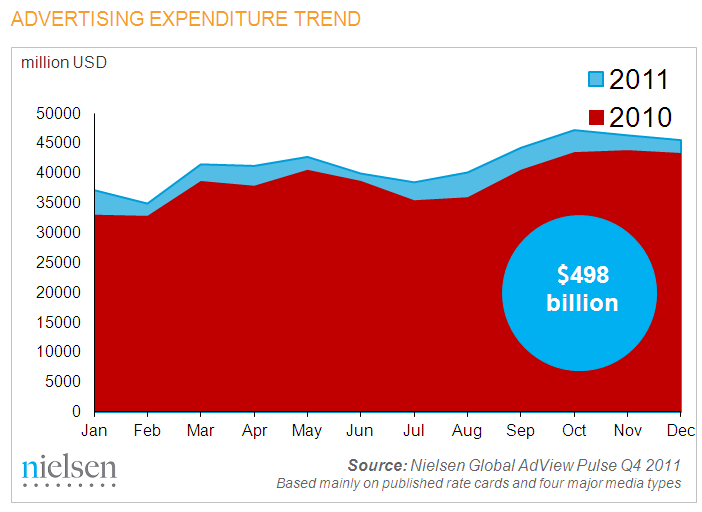
2011 continued to be a challenging year for the global economy, which was impacted by natural disasters, political uprisings, and the ripple effects of financial crises in both the U.S. and Western Europe. After a boost in advertising spending in Q3 2011, many of the world’s biggest advertisers exercised more caution in Q4, but 2011 still showed an overall 7.3 percent increase in spending vs. 2010.

According to Nielsen’s quarterly Global AdView Pulse report, global advertising in 2011 totaled USD 498 billion (mainly based on published rate cards and four traditional media types), and Q4 2011 closed with 131 billion, up 6.2 percent over the same period in 2010.
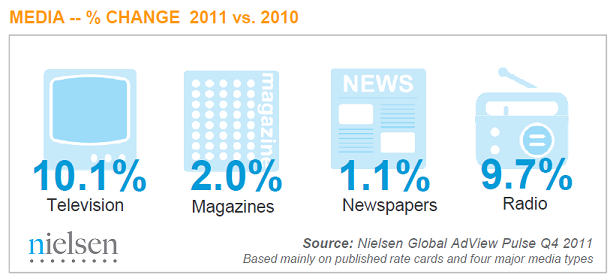
All traditional media types showed positive trends globally in 2011, with Television and Radio seeing the highest percentage increases of 10.1 percent and 9.7 percent respectively. Television ad spend, which holds a 65 percent share of ad spending, grew in all regions.
Spending for Internet, Outdoor, and Cinema also all showed increases in 2011 when compared with 2010. Internet ad spending, which grew by 24 percent in 2011 vs. 2010, saw increases in almost all markets measured.

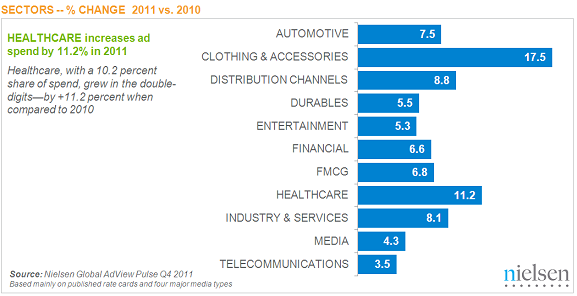
Looking at expenditures by industry, Clothing & Accessories and Healthcare showed the largest increases, up 17.5 percent and 11.2 percent respectively over 2010.

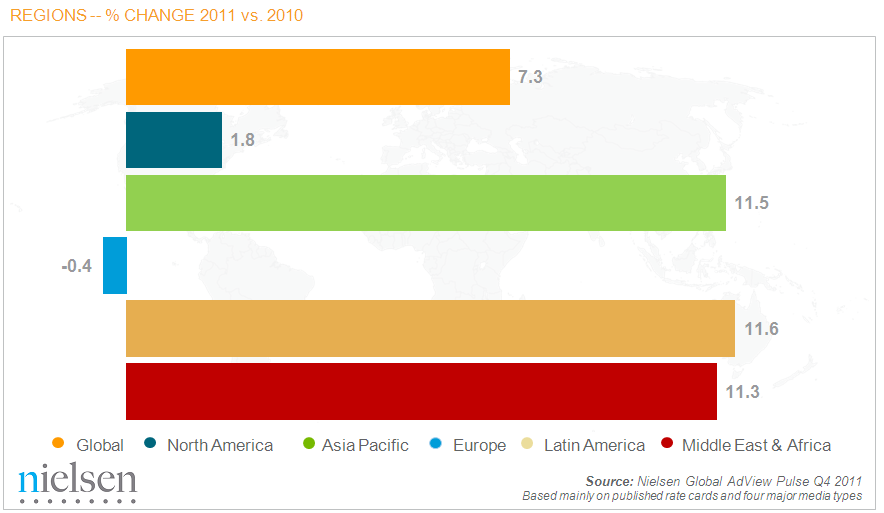
In the U.S., advertising showed a 0.2 percent decline year-on-year during Q4, but increased 2 percent in 2011 vs. 2010. The European advertising market decreased spending by 0.4 percent in 2011 compared with 2010. Though many Northern European advertising markets measured marginally increased spending during 2011, larger decreases were seen in the Southern European markets of Greece (-13.1%), Italy (-4.0%), and Spain (-9.7%).
The ad market in Middle East & Africa ended 2011 with an 11.3 percent increase in spend vs. 2010, while Asia Pacific was up 11.5 percent in 2011. Clothing & Accessories saw the greatest percentage increase in ad spending in Asia Pacific at 28 percent during 2011. Latin America also continued to be a region for advertising growth in 2011, with an 11.6 percent increase over 2010.

Methodology
The external data sources for the other countries included in the report are:
Argentina: IBOPE
Brazil: IBOPE
Egypt: PARC (Pan Arab Research Centre)
France: Yacast
Greece: Media Services
Hong Kong: admanGo
Japan: Nihon Daily Tsushinsha
Kuwait: PARC (Pan Arab Research Centre)
Lebanon: PARC (Pan Arab Research Centre)
Mexico: IBOPE
Pan-Arab Media: PARC (Pan Arab Research Centre)
Portugal: Mediamonitor
Saudi Arabia: PARC (Pan Arab Research Centre)
Spain: Arce Media
Switzerland: Nielsen in association with Media Focus
UAE: PARC (Pan Arab Research Centre)


