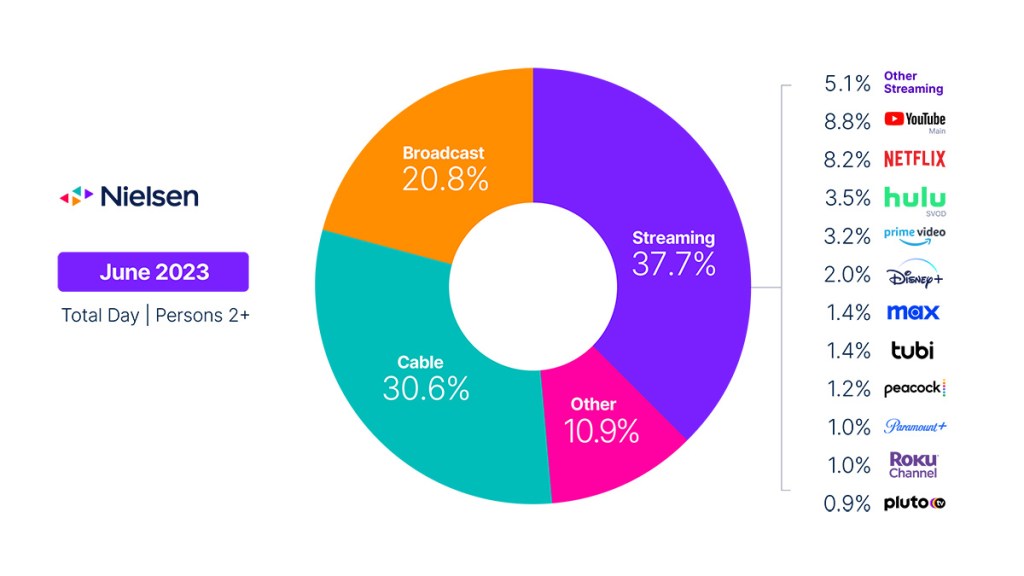
Streaming captures 37.7% of total TV viewing; Paramount+ enters with 1% of TV usage
As kids closed their books to end another school year, TV usage trends in June began to turn the corner after a four-month seasonal lull that began in February. For kids 2-17, streaming and video gaming provided a nice break from the classroom—and a 2.2% increase in total TV usage across all age groups.
Among kids 2-17, non-traditional TV options accounted for 90% of their increased usage. Kids 2-11 increased their TV time by 16.3%, while kids 12-17 spent 24.1% more time with TV compared with May.
- Among kids 2-11, streaming accounted for 62% of the increase, and “other” usage accounted for 30%, primarily attributed to video game console usage.
- Among kids 12-17, the increased time was fairly evenly split at 43% and 46% for streaming and other, respectively.
Compared with relatively flat cable usage and a 6.6% drop in broadcast usage, streaming usage jumped 5.8% to secure 37.7% of total TV, a new high-water mark. S.W.A.T. played a big role in that increase, attracting almost 5 billion minutes after becoming available on Netflix in mid-May alongside Hulu and Paramount+. Star Trek: Strange New Worlds was another audience pleaser, generating almost 1 billion minutes of viewing after season 2 dropped in mid-June. The boost helped Paramount+ capture 1% of TV viewing and obtain stand-alone coverage in The GaugeTM. Other streaming highlights included:
- Tubi TV was the leading FAST service, as usage increased 12.1% to account for 1.4% of TV usage (up from 1% in February 2023 and tied with Max).
- Disney+ benefited from increased kids viewing, as usage grew 11.9% to account for 2% of TV.
- Max usage jumped 16.5% to gain 0.2 share points.
- YouTube usage inched closer to 9% of TV usage, and Netflix gained 0.3 share points to capture 8.2% of TV.
Within traditional TV programming, cable and broadcast usage reflected trends that are typical for summer. Broadcast viewing accounted for just 20.8% of total TV, reflecting a new low-water mark. Cable usage inched up 0.4% on the strength of feature films (up 10%) and news (up 6.6%), but lost 0.6 share points due to the increase in total TV usage. The NBA Conference finals were the top program on cable, but they weren’t enough to offset a 38% drop in sports viewing on cable. Comparatively, they helped drive a 31.7% increase in sports viewing on broadcast. On a year-over-year basis, broadcast usage was down 5.6% and cable viewing was down 11.6%.
Even with minimal new programming on broadcast and cable, the expanding array of streaming options and engaging content showcases the ongoing attraction of the TV—and everything it provides access to. That access may become critical for those who opt to seek refuge from the rising heat and wait out the dog days of summer indoors with all that our TVs can now deliver right to our living rooms.
June data trends with Brian Fuhrer
The Gauge provides a monthly macroanalysis of audience viewing behaviors across key television delivery platforms, including broadcast, streaming, cable and other sources. It also includes a breakdown of the major, individual streaming distributors. The chart itself represents monthly total television usage, broken out into share of viewing by category and by individual streaming distributors.
Methodology and frequently asked questions
How is ‘The Gauge’ created?
The data for The Gauge is derived from two separately weighted panels and combined to create the graphic. Nielsen’s streaming data is derived from a subset of Streaming Meter-enabled TV households within the National TV panel. The linear TV sources (broadcast and cable), as well as total usage are based on viewing from Nielsen’s overall TV panel.
All the data is time period based for each viewing source. The data, representing a broadcast month, is based on Live+7 viewing for the reporting interval (Note: Live+7 includes live television viewing plus viewing up to seven days later for linear content).
What is included in “Other”?
Within The Gauge, “Other” includes all other TV usage that does not fall into the broadcast, cable or streaming categories. This primarily includes all other tuning (unmeasured sources), unmeasured video on demand (VOD), audio streaming, gaming and other device (DVD playback) use.
Beginning with the May 2023 interval, Nielsen began utilizing Streaming Content Ratings to identify original content distributed by platforms reported in that service to reclassify content viewed via cable set top boxes. This viewing will credit to streaming and to the streaming platform which distributed it. It will also be removed from the other category, where it was previously reflected. Content not identified as original within Streaming Content Ratings and viewed through a cable set top box will still be included in other.
What is included in “other streaming”?
Streaming platforms listed as “other streaming” includes any high-bandwidth video streaming on television that is not individually broken out. Apps designed to deliver live broadcast and cable (linear) programming (VMVPD or MVPD applications like Sling TV or Charter/Spectrum) are excluded from “other streaming.”
Where does linear streaming contribute?
Linear streaming (as defined by the aggregation of viewing to vMVPD/MVPD apps) is excluded from the streaming category as the broadcast and cable content viewed through these apps credits to its respective category. This methodological change was implemented with the February 2023 interval.
What about live streaming on Hulu and YouTube?
Linear streaming via vMVPD apps (e.g., Hulu Live, YouTube TV) are excluded from the streaming category. ‘Hulu SVOD’ and ‘YouTube Main’ within the streaming category refer to the platforms’ usage without the inclusion of linear streaming.