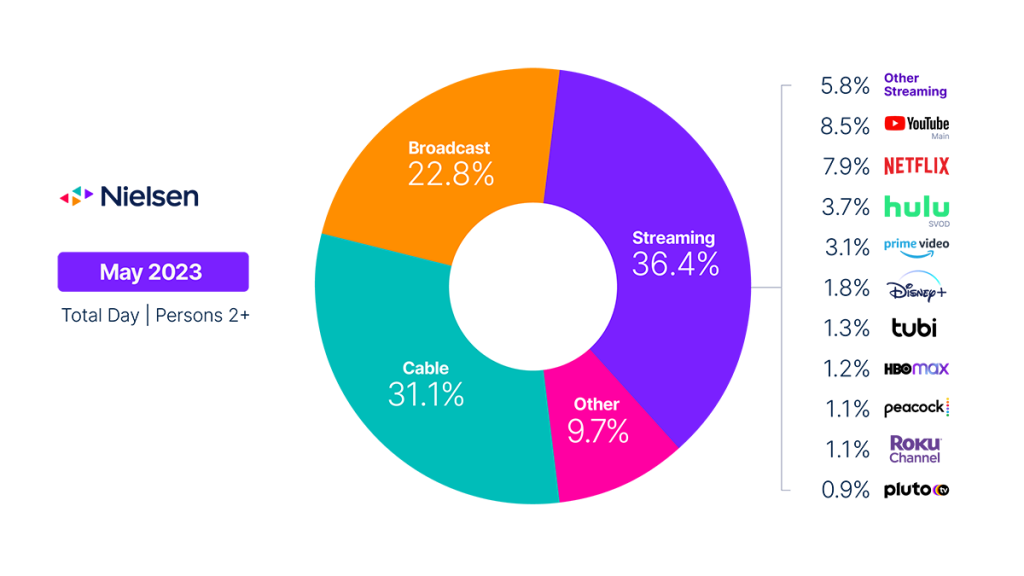
Streaming grabs 36.4% of total TV viewing; Roku Channel enters with 1.1% of TV usage
Editor’s note: We have implemented a methodology change that credits the viewing to streaming originals (as identified by Nielsen Streaming Content Ratings) via cable set-top boxes to the streaming category. This viewing was previously included in the “other” category.
After a 2.1% dip in viewing in April, streaming usage rebounded in May to capture 36.4% of TV, and audiences continue to tap into the growing range of services. While a methodology change to more fully capture streaming usage was a factor in the monthly uptick, approximately half of the 2.5% increase in monthly usage reflected viewing behavior. Separately, the Roku Channel is the latest service to obtain stand-alone coverage in The Gauge, capturing 1.1% of total TV usage in May. Despite the streaming gains, however, total TV usage fell 4.4% from April.
The breakout performance of the Roku Channel in May highlights the increasing footprint of free ad-supported television (FAST) services. Combined, the three FAST services that are independently reported in The GaugeTM (Pluto TV, Tubi TV, Roku Channel) are each comparable in usage to Peacock and HBO Max. And in aggregate, they account for more viewership than Amazon Prime Video.
Netflix and Amazon Prime Video each gained momentum in May, posting usage gains of 9.2% and 5.1%, respectively. Roughly half of the Netflix increase was driven by the methodology change, coupled with the fact that the platform had the top three streaming titles this month: Queen Charlotte: A Bridgerton Story (5.4 billion viewing minutes), A Man Called Otto (3.1 billion) and The Mother (3.0 billion). Capturing 3.1% of TV, Amazon Prime Video benefitted from the strength of The Marvelous Mrs. Maisel and Citadel, which combined for 2.7 billion minutes. And for the fourth straight month, YouTube maintained its stance as the top platform, gaining 0.4 share points to account for 8.5% of TV.
The 4.4% drop in total TV viewing in May was driven by reduced broadcast and cable viewing, which posted drops of 5.5% and 5.4%, respectively. The declines caused broadcast and cable to each surrender 0.3 share points. A 25% drop in sports viewing was largely responsible for the declines on broadcast, but viewership of the Kentucky Derby outpaced NCIS, Young Sheldon, Blue Bloods, Ghosts and FBI. Cable ended its streak of share gains in the previous two months, but the extensive coverage of the NBA Finals on ESPN and TNT fueled a 12% increase in sports viewership, and accounted for the top four cable programs in May. And despite the traction that the CNN Town Hall generated, news viewing fell more than 11% from April. On a year-over-year basis, broadcast viewing was down 5.6% and cable viewing was down 13.7%.
May data trends with Brian Fuhrer
Methodology change explained
Methodology and frequently asked questions
The Gauge provides a monthly macroanalysis of audience viewing behaviors across key television delivery platforms, including broadcast, streaming, cable and other sources. It also includes a breakdown of the major, individual streaming distributors. The chart itself represents monthly total television usage, broken out into share of viewing by category and by individual streaming distributors.
How is ‘The Gauge’ created?
The data for The Gauge is derived from two separately weighted panels and combined to create the graphic. Nielsen’s streaming data is derived from a subset of TV households within our National Panel that are Streaming Meter-enabled. The linear TV sources (broadcast and cable), as well as total usage are based on viewing from Nielsen’s overall TV panel.
All the data is time period based for each viewing source. The data, representing a broadcast month, is based on Live+7 viewing for the reporting interval (Note: Live+7 includes live television viewing plus viewing up to seven days later for linear content).
What is included in “Other”?
Within The Gauge, “Other” includes all other TV usage that does not fall into the broadcast, cable or streaming categories. This primarily includes all other tuning (unmeasured sources), unmeasured video on demand (VOD), audio streaming, gaming and other device (DVD playback) use.
Beginning with the May 2023 interval, Nielsen began utilizing Streaming Content Ratings to identify original content distributed by platforms reported in that service to reclassify content viewed via cable set top boxes. This viewing will credit to streaming and to the streaming platform which distributed it. It will also be removed from the other category, where it was previously reflected. Content not identified as original within Streaming Content Ratings and viewed through a cable set top box will still be included in other.
What is included in “other streaming”?
Streaming platforms listed as “other streaming” includes any high-bandwidth video streaming on television that is not individually broken out. Apps designed to deliver live broadcast and cable (linear) programming (VMVPD or MVPD applications like Sling TV or Charter/Spectrum) are excluded from “other streaming.”
Where does linear streaming contribute?
Linear streaming (as defined by the aggregation of viewing to vMVPD/MVPD apps) is excluded from the streaming category as the broadcast and cable content viewed through these apps credits to its respective category. This methodological change was implemented with the February 2023 interval.
What about linear streaming on Hulu and YouTube?
Linear streaming via vMVPD apps (e.g., Hulu Live, YouTube TV) are excluded from the streaming category. ‘Hulu SVOD’ and ‘YouTube Main’ within the streaming category refer to the platforms’ usage without the inclusion of linear streaming.