College Football Scores Top Telecast in August with 16M+ Viewers on FOX, Followed by Three Games on ABC with 10M+ Viewers Each
Prime Video Achieves Best Monthly Share Since December as Lone Gainer Among Streamers
Netflix Owns Top Four Streaming Titles with 22 Billion Combined Minutes
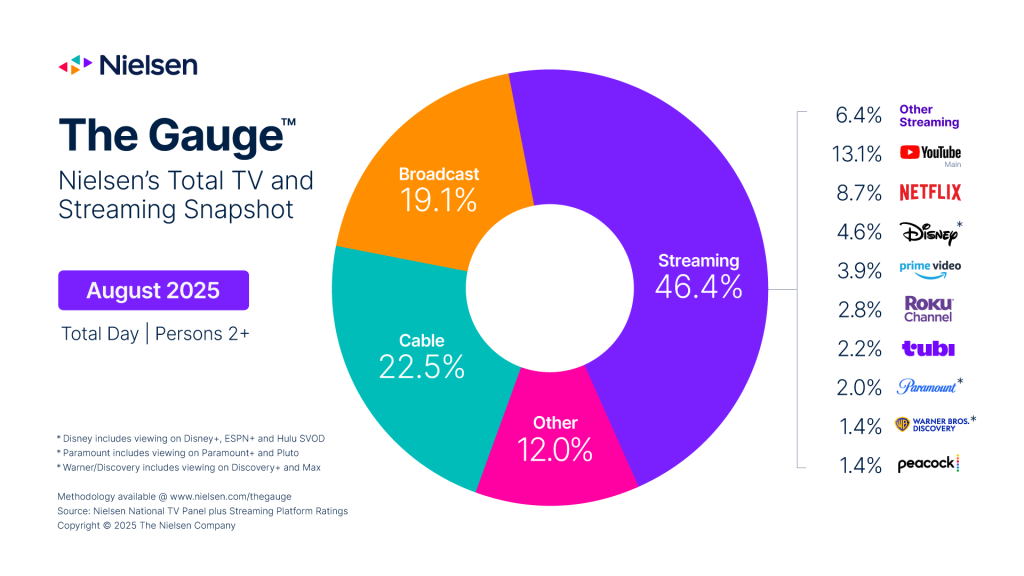
NEW YORK – September 16, 2025 – The dynamics of a new school year and the return of football collided in August to disrupt summer TV trends, signaled by gains for broadcast and cable for the first time since April, according to Nielsen’s monthly report of The Gauge™, the media industry’s leading snapshot of total TV and streaming consumption. Broadcast and cable combined to add a full share point over last month, representing 19.1% and 22.5% of TV, respectively, and ending a three months-long decline for traditional TV.
Broadcast notched its largest share of TV since May as viewership climbed 1.1% on a monthly basis. Across the five-week measurement interval, the peak in broadcast viewership occurred during the final week of the month (08/25/25-08/31/25), coinciding with the official return of college football. FOX’s first Big Noon Saturday game of the season between Ohio State and Texas on August 30 drew the largest telecast audience this month with over 16.6 million viewers. ABC owned the next three top telecasts with college football games that each drew over 10 million viewers, including Notre Dame vs. Miami, Alabama vs. Florida State, and LSU vs. Clemson.
Cable viewing represented 22.5% of TV watch-time in August, gaining 0.3 share points versus July. Like broadcast, cable viewing was strongest in the final week of the interval, primarily among 18-49 year-olds. This peak was also driven by college football coverage, specifically on ESPN. Moreover, cable sports viewing in August was up 30% compared to the prior month, and represented over 9% of all cable viewership.
Time spent streaming declined over 4% in August compared to July and represented 46.4% of TV (-0.9 points). Although monthly viewing levels were down for each streaming platform in The Gauge in August, one streamer managed to gain share: Prime Video added 0.1 point and finished the month with 3.9% of TV—its best so far in 2025, and just shy of its platform record (4.0%) set in December 2024. Prime Video benefited from two of its original series, The Summer I Turned Pretty and Ballard, in addition to an NFL preseason game on August 21.
Netflix accounted for 8.7% of TV watch-time in August (-0.1 point vs. July), and continued to dominate the month’s top streaming programs: Netflix originals Wednesday, KPop Demon Hunters and The Hunting Wives, plus acquired series Sullivan’s Crossing, took the top four slots and combined for over 22 billion viewing minutes across the five weeks of the interval.
Coming out of several consecutive streaming-heavy months, the decrease in viewing from younger audiences caused by back-to-school variables tends to have a larger impact on overall viewing trends. Time spent watching TV was down 2% overall in August versus July, but viewing among kids and teens (age 6-17) was down 9% over the same period. Additionally, when isolating watch-time by week among this age group, viewing levels between the first and last weeks of the interval (07/28/25-08/03/25 vs. 08/25/25-08/31/25) dropped 21%. Streaming usage among school-aged viewers also exhibited similar declines, dropping 8% on a monthly basis in August, and losing 22% from the first week versus the last week of the month.
The August 2025 interval spanned five weeks, from 07/28/2025 through 08/31/2025. Nielsen reporting follows the broadcast calendar, with weekly intervals beginning on Monday.
Note: Paramount’s streaming total in July was originally reported as 1.9% and has since been updated to 2.0%.
About The Gauge™
The Gauge™ is Nielsen’s monthly snapshot of total broadcast, cable and streaming consumption that occurs through a television screen, providing the industry with a holistic look at what audiences are watching. The Gauge was expanded in April 2024 to include The Media Distributor Gauge, which reflects total viewing by media distributor across these categories. Read more about The Gauge methodology and FAQs.
About Nielsen
Nielsen is a global leader in audience measurement, data and analytics. Through our understanding of people and their behaviors across all channels and platforms, we empower our clients with independent and actionable intelligence so they can connect and engage with their global audiences—now and into the future. Learn more at www.nielsen.com and connect with us on social media (X, LinkedIn, YouTube, Facebook and Instagram).
Press Contact
Lauren Pabst
