The core purpose of this report is to address three basic concepts equally applicable to all categories of media measurement: how many, how often, and how long.
Beginning this quarter, there are some important enhancements and updates to the report. Most notably, we have expanded the reporting period to include the full 13 weeks that make up both Q1 2015 and Q1 2016. This serves two important functions. First, this gives us a fully comprehensive look at usage across the entire quarter rather than viewing a 5-6 week snapshot. Second, we now have the ability to directly compare and align metrics with Nielsen’s Total Audience Report, allowing the two reports to be used concurrently to gain a better understanding of the marketplace.
Some of the calculations for TV and TV-Connected devices have also been updated. Gross minutes will continue to include visitor viewing time and, as a result, minutes/adult (population) remains unchanged. However, the calculations for minutes/day (users) and minutes/adult (users) will not include visitor viewing time as we cannot factor in how that affects frequency (usage days/week).
Panel enhancements made in March 2016 have also affected smartphone and tablet reporting. A legacy crediting rule on iOS devices that capped usage at 30 minutes was removed, so now if a panelist uses an app or visits a website for more than 30 minutes at a time the entire time for the session is now credited. This rule will also be implemented for Android devices in the coming months. Removal of the 30 minute cap did result in some increase in time spent but most can be attributed to gains in users and the organic growth of app and web usage, not the change in the rule.
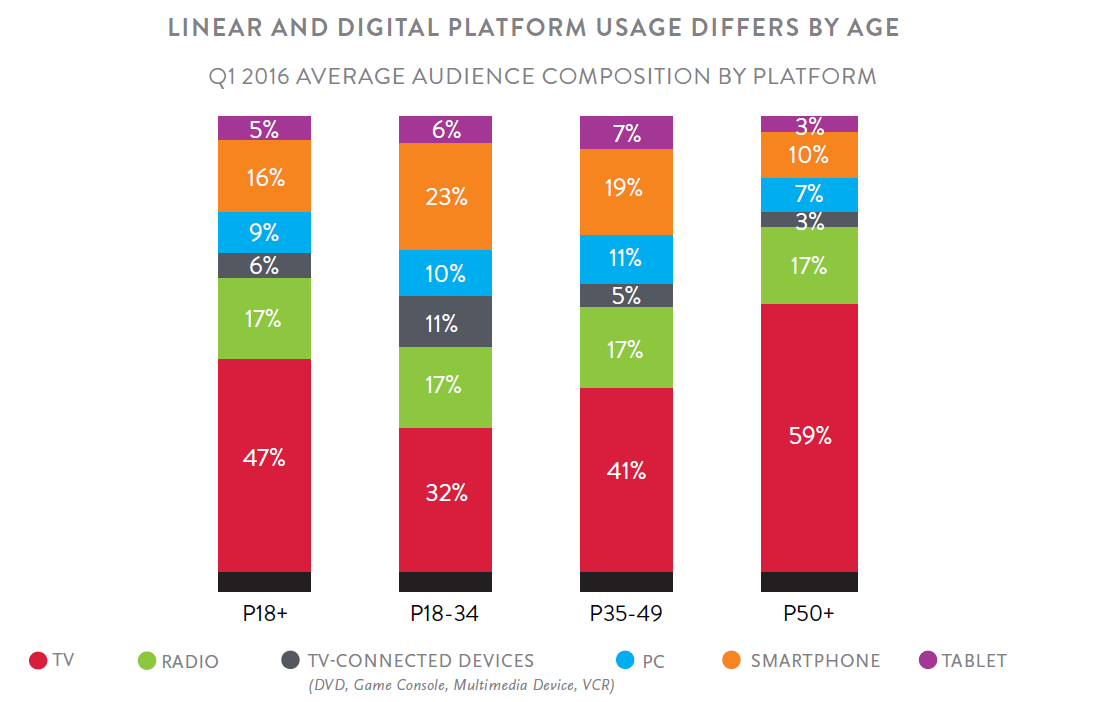
Average Audience Composition