For media companies, the fall TV season is when the rubber meets the road. Networks and agencies white knuckle themselves into a fervent state while they anxiously wait to see if audiences revel in their new program offerings. Meanwhile, agencies have already placed their ad bets and are intently watching to see what adjustments they need to make as the game plays out. Meanwhile, viewers hold all the cards, eagerly sampling the new shows, offering plenty of endorsement and critique along the way.
So with all this commotion around fall TV, what role does Twitter activity around new shows play in it all?
We dove into this question on the heels of the fall 2014 premiere season. We evaluated how Twitter TV activity, tracked on a 24/7 basis ahead of the premieres of brand new programs, could have been used to anticipate the sizes of the audiences that watched the premiere episodes of those programs. And in looking at the data, Twitter TV activity did prove out as an additional signal that could be used together with other factors to anticipate premiere audience sizes. This is notable because if Twitter TV activity could be used along side other data sources to help determine TV audiences, then agencies could fine-tune their buys before the premieres. Networks could identify potential winners and challenges earlier to maximize ad sales and course-correct marketing activities. And, to the extent that social media leads people to become aware of new shows, networks could leverage Twitter TV activity to better reach their intended audiences.
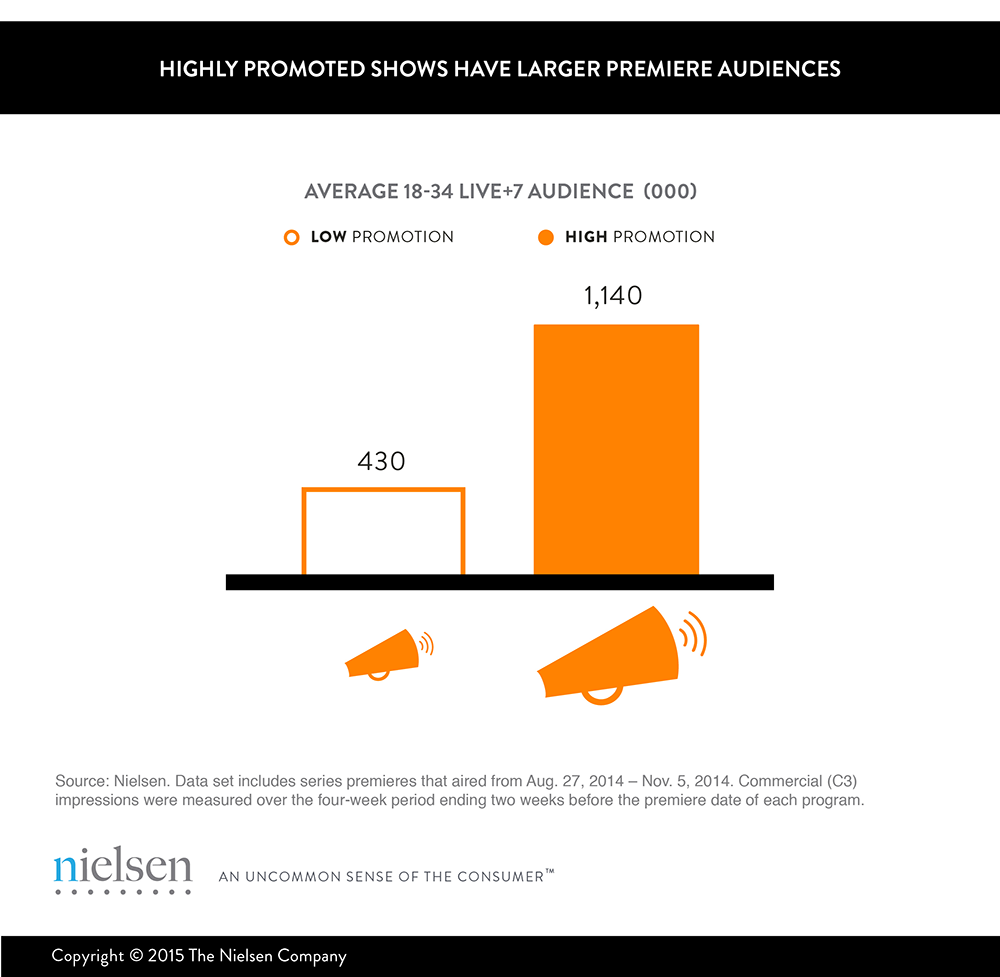
We analyzed 42 broadcast and cable series premieres, including English- and Spanish-language programming, from late August through early November. To start, we looked for a correlation between how many times viewers 18-34 saw TV promotions for a specific program and the size of that program’s audience for the premiere episode. Naturally, we would expect highly promoted programs to garner larger audiences, and that is what we saw. In other words, without including Twitter TV data in the analysis, we confirmed that programs that were promoted more substantially saw higher premiere audiences. To be truly useful then, Twitter TV activity would need to tell an additional story on top of what we already know from promotions alone.
So, can an understanding of Twitter TV activity before a premiere help networks and agencies to more precisely gauge audience outcomes than exposure to promotions alone? In other words, what additional value does Twitter TV activity bring in anticipating audience sizes?
To answer these questions, we created a model to determine the expected live+7 day (L+7) audience of 18-34 viewers using three variables:
- Promotion activity: Commercial (C3) impressions
- Twitter TV activity: Program-related Tweets (24/7 tracking)
- Network type: Broadcast vs. Cable
The time period for both promotions and Twitter TV activity was the four-week period ending two weeks before the premiere date of each program, the same time period that was used in analyzing the correlation between promotions and audience sizes. We used this time period to ensure comparability across programs and to demonstrate that an agency or a network could potentially take action, in the weeks and days leading up to a premiere, using a similar approach.
We compared the results of our model to actual premiere audience sizes to understand how useful a similar model would have been at indicating premiere success. For example, the chart below shows that the model indicated an audience size of 1.5 million viewers aged 18-34 for the premiere of program A, almost exactly what the actual audience was for the premiere. While that audience size indicated by the model did not always exactly reflect the actual audience size of a program’s premiere, you can see that expectations were directionally aligned with the actual audiences that premieres attracted. For example, this model correctly anticipated that programs A, B, C, D and E would be among the top 10 programs, based on their actual premiere audience sizes.
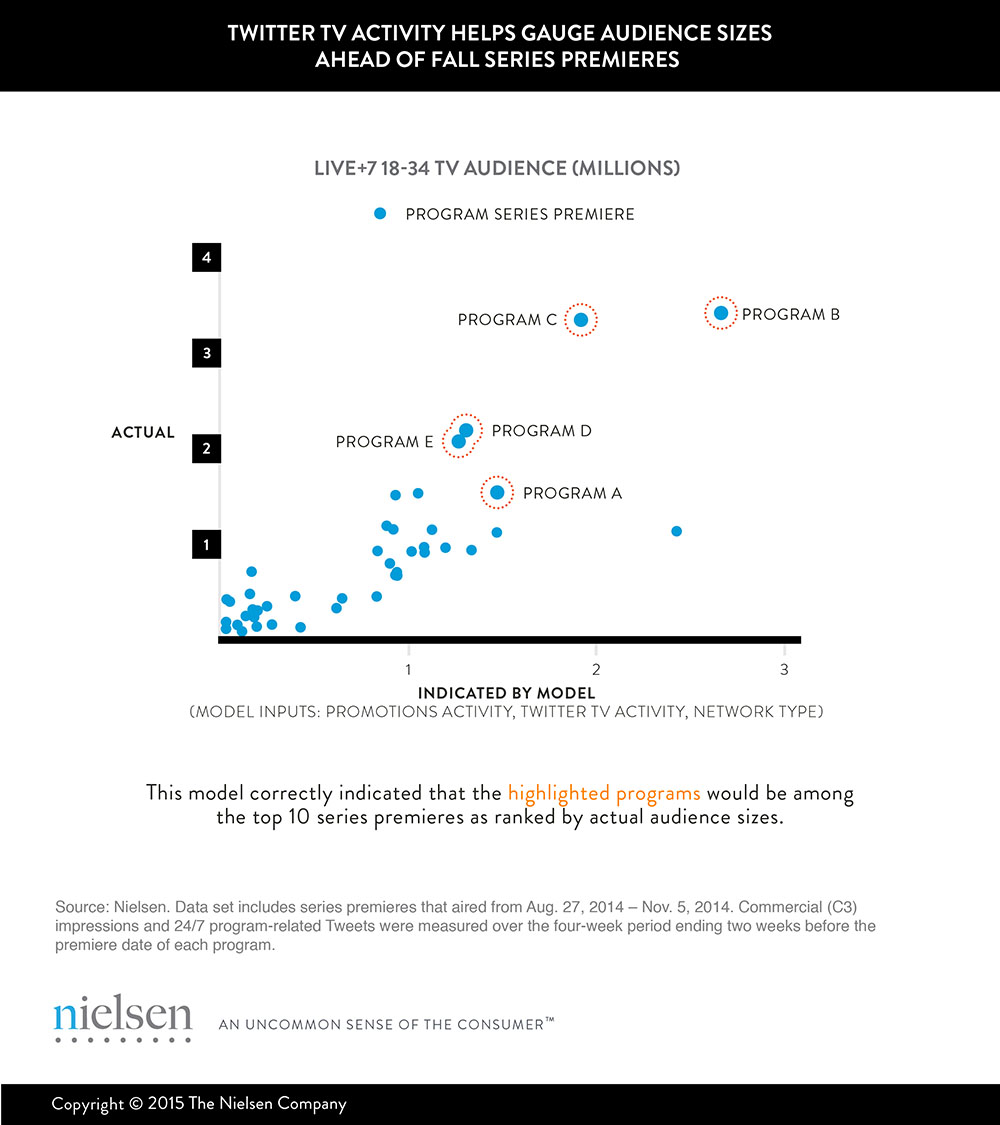
While this model is based on only 42 data points, the overall model and all three variables are statistically significant. The model explains 65% of the variance in the premiere audience sizes, compared with 48% using promotions data alone. So, these three variables together can explain nearly two-thirds of the difference in premiere audience sizes. Most importantly, an agency or a network could have used this model to identify the top 10 and bottom 10 program premieres more precisely than by relying on promotion data alone.
To be clear, the findings do not necessarily mean that Twitter TV activity causes larger audience sizes. But, even if the relationship isn’t causal, our current and recent research efforts increasingly indicate that Twitter TV activity and reach data can help networks and agencies make superior, data-driven advertising and program marketing decisions.