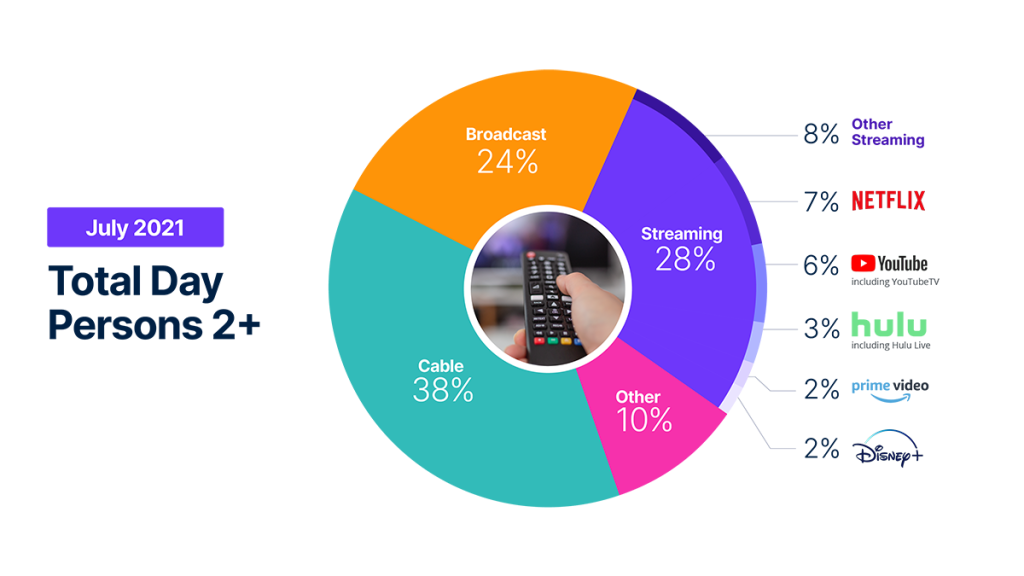
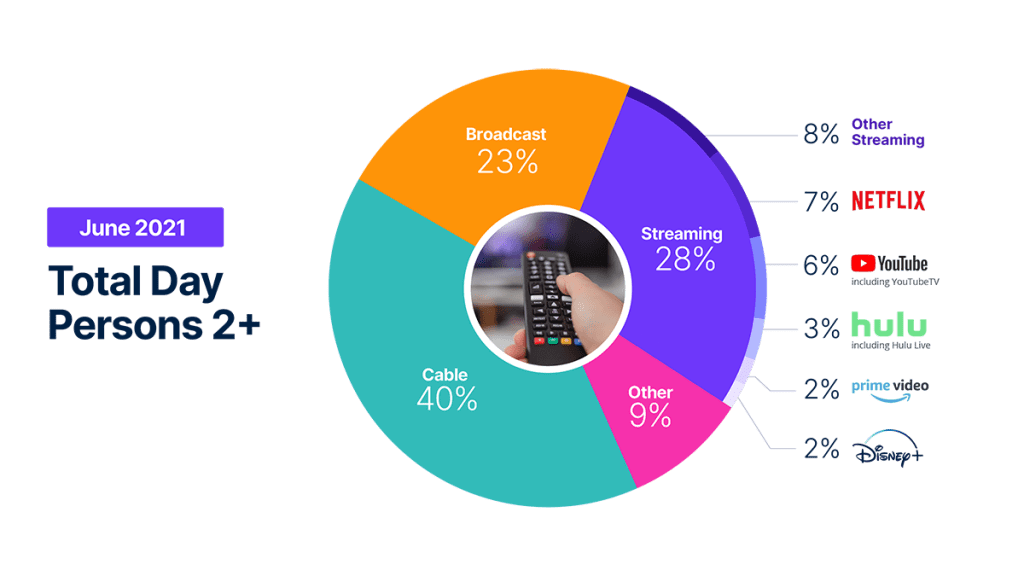
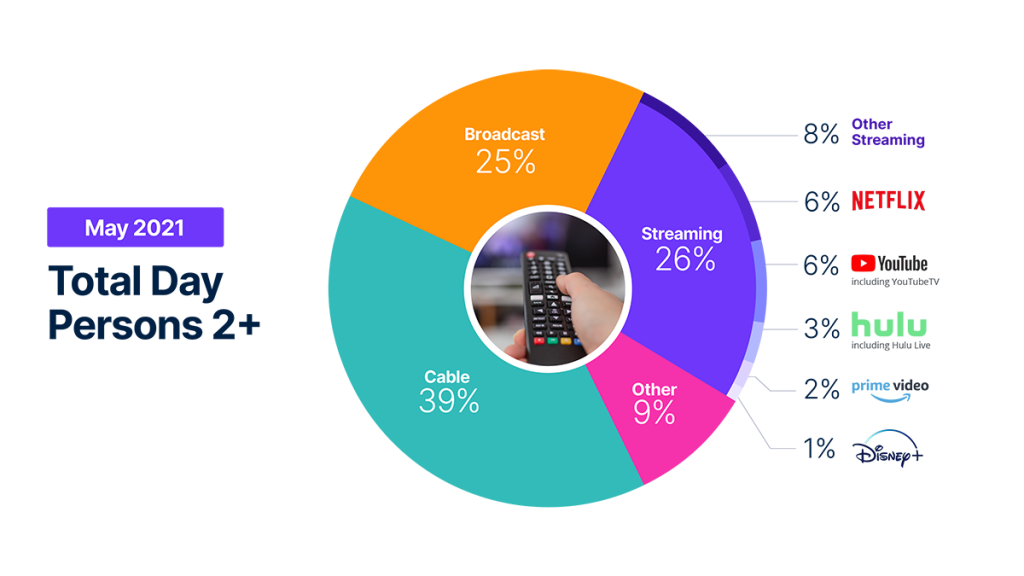
In July, broadcast recaptured television viewers, growing a percentage point thanks to high-profile sporting events coupled with the opening weekend of the Olympics. This shift in viewing meant that cable gave up some ground while streaming also picked up a share point. This is potentially a precursor to August viewership behavior, which will reflect the full duration of the Olympics. At 28% share, streaming benefitted from the continued momentum of the growing stable of streaming services and a healthy influx of new content to the more established services. While it may be too early to call it a trend, streaming has gained 1% with each interval of The Gauge since its release.
Take me to the methodology details below.
“Behind the scenes, sports also likely impacted streaming’s share. This includes many of the Olympics highlights clips, which were posted on YouTube, where we saw some minutes increase. We’ll stay tuned for next month when we’ll have the full impact of the Games to review,” said Brian Fuhrer, SVP, Product Strategy at Nielsen.
Watch the video to hear Brian discuss how sports played an outsized impact on July’s share of television viewership, building from last month’s conclusion of the broadcast season, to the NBA Playoffs on to the Olympics.
Methodology
The Gauge is a monthly interval showing the Total Usage of Television (TUT) for Broadcast, Streaming, Cable and Other with a Streaming channel drill down.
- All other TV includes: The primary components of this are AOT (ALL Other Tuning), VOD, Streaming through a cable set top box, Gaming, and other device (DVD Playback) use.
- Other streaming is any high bandwidth (video) streaming to the television not listed.
- Statistics: Share by category, Share of TUT broken out for Streaming Distributors
- Streaming via Cable Set Top Boxes does not credit the respective streaming distributors, but instead is included in the “All Other” group. Crediting individual streaming distributors is something we continue to pursue as an enhancement to our Streaming Meter technology.
- Data used is derived from two separately weighted panels and combined to create the infographic. Streaming data comes from a subset of TV households in the National TV panel that are enabled with the Streaming Meter, while linear sources as well as total usage are based on viewing from the overall TV panel.
- All data is based on time period viewing sources.
- Hulu includes viewing on Hulu Live. Youtube includes viewing on Youtube TV.
- Encoded linear streaming is reflected in both the linear (broadcast, cable) group as well as under the respective linear streaming app (e.g. Hulu Live, Youtube TV, Other Streaming MVPD/vMVPD apps
- Data are based on a combination of Live+7 for Weeks 1-3 and Live+3 for Week 4


