In 2017, hip-hop/R&B surpassed rock to become the most popular music genre in the U.S.*, highlighting a culmination of shifting trends in music preferences, accessibility and consumption metrics and modes, that continue to redefine the music industry and what goes into artist and label success. As music production, distribution and marketing efforts evolve in tandem with these trends, so do the music charts that serve as the leading measures of success for the industry.
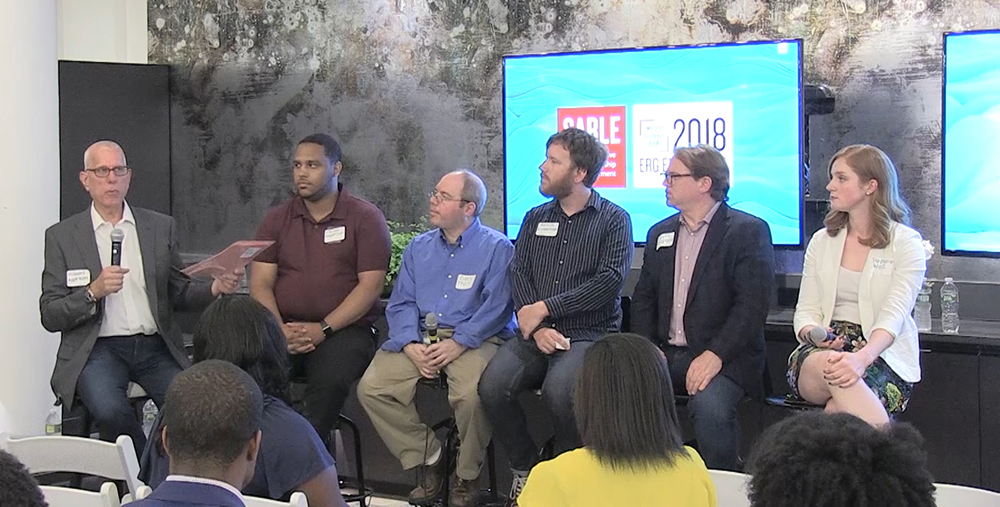
To celebrate African-American Music Appreciation Month, our SABLE (Sustaining Active Black Leadership and Empowerment) employee resource group (ERG) hosted a panel of music executives on June 27 to explore what it takes to get a No. 1 album/song on the Billboard charts today, and why having a song at the top of the charts continues to have so much relevance in the music industry.
Moderated by Howard Appelbaum, President, Nielsen Entertainment, the SABLE panel tackled these questions and more from the perspective of data experts in digital and radio, but also from those they interact with regularly—label executives, artists and fans.
“We have about 200 charts overall,” noted Gary Trust, Co-Director of Charts, Hot 100 Chart Manager, Chart Beat Editor, Billboard. “The Billboard Hot 100 Songs chart and the Billboard 200 Albums chart get a pretty hefty share of views online and media play overall because they’re the all-genre charts, and they [have a really deep history]; stuff that’s happening now we can compare to what Elvis or the Beatles did decades ago. That’s what gives such importance to the charts, and why people like following them so much—artists, fans, everyone in the business.”
Breaking the mold of a traditional panel, Appelbaum and the panelists seamlessly wove in questions from a very engaged audience throughout the hour-long discussion that paired perfectly with the prepared data, insights and topics that included what data goes into the Billboard music charts and what role Nielsen Entertainment data plays in chart production.
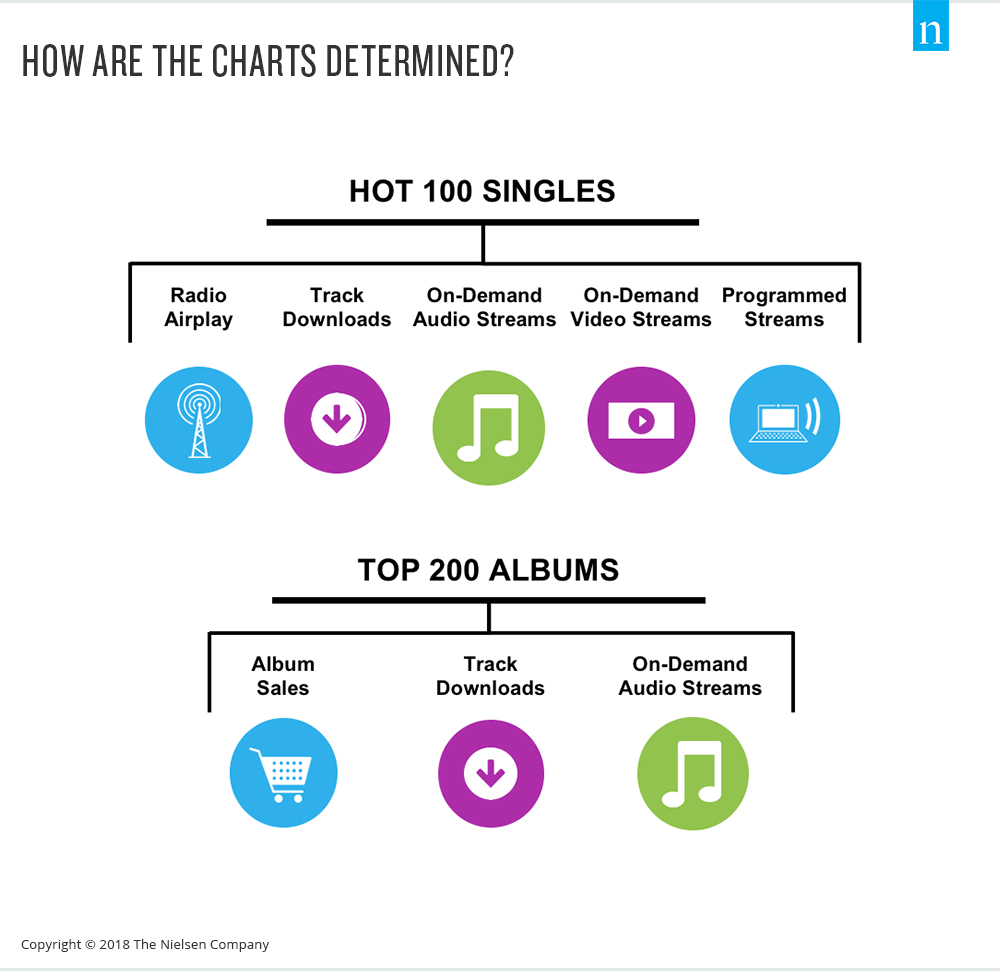
Scott Musgrave, Head of U.S. Radio Client Solutions, Nielsen Music, commented that the data collection process used to make the charts creates a real picture of what’s happening across the U.S. music landscape. In the end, the charts reflect both what people are listening to and what radio stations are playing.
“Nielsen BDSRadio is a tool that program directors use at radio stations and the two key pieces of data that they look at are “spins,” the number of times a radio station spins a song,” said Scott. “We collect that by format and by genre of radio stations in the country. We also collect data from streaming providers.”
Approximately 50 guests attended from companies including Spotify, Facebook, Mindshare, Pepsico, Etsy, Conde Nast and more. Following the panel, guest enjoyed networking and fellowship in the Nielsen Tech Hub event space.
The event was a part of enERGize week, a week-long experience focused on demonstrating the value and impact of employee resource groups at Nielsen. Find out more information about our diversity and inclusion initiatives here.
*Source: Nielsen 2017 U.S. Music Year-End Report.
Pictured above: (Left to right) Howard Appelbaum, President, Nielsen Entertainment, Trevor Anderson, Associate Chart Manager, Social/Streaming, Billboard, Gary Trust, Co-Director of Charts, Hot 100 Chart Manager, Chart Beat Editor, Billboard, Kevin Rutherford,Chart Manager, Rock/Social/Streaming, Billboard, Scott Musgrave, Head of U.S. Radio Client Solutions, Nielsen Music, and Stephanie Walz, Client Solutions Manager, WMG, Nielsen Entertainment.
