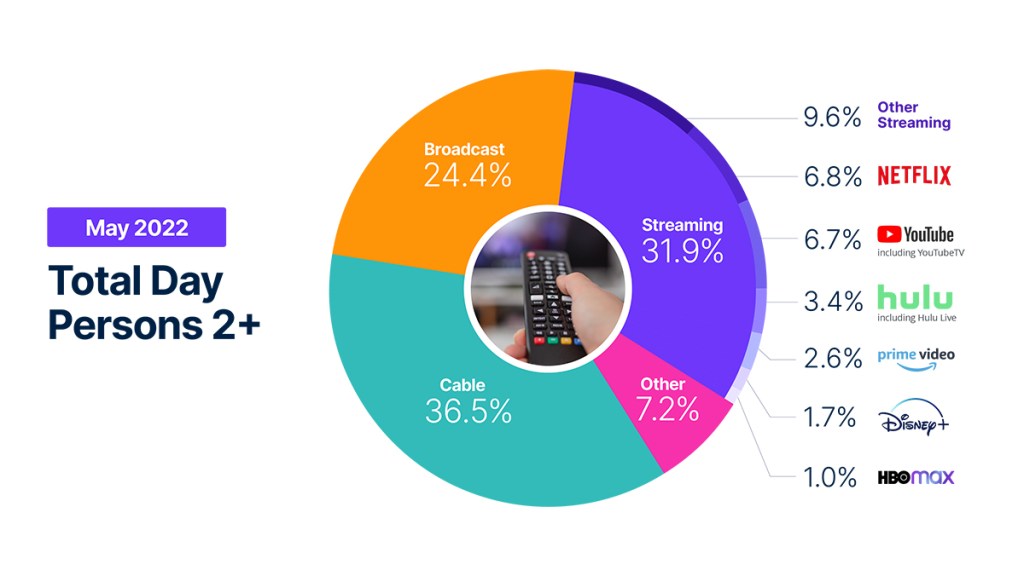
Much like many activities, television viewing has historical norms, many of which are driven by the calendar. The growth of streaming, however, continues to change history, as streaming viewership hit yet another new high in May, claiming 31.9% of total TV time.
May is historically the month when TV viewership is at its lowest, and this year fell in line with that trend, as total time with TV fell 2.7%. Compared with broadcast and cable viewing, however, streaming usage increased by 2%, amplified by the release of Obi-Wan Kenobi on Disney+ and season 4 of Stranger Things on Netflix. The appetite for these titles was significant, helping the two platforms attract big viewership as the programs dropped: Disney+ attracted 2.5% of the total TV share on May 27, and Netflix claimed 9.0% on Saturday, May 28.
Also in line with historical norms, broadcast and cable viewing both declined in May, as viewing volume fell 3.5% for each. Drama continued to drive broadcast viewership, with procedural crime dramas like NCIS, FBI and Blue Bloods helping the genre capture one-third of the broadcast viewing. While cable news viewing was down 4.2% in May, sports viewing was up 7%, accounting for 9% of total cable viewing. Notably, NBA playoff games accounted for the top six most-viewed cable programs during the month.
Summertime marks a lull period for traditional television, and it could be an inflection point for the adoption of the expanding streaming platforms. Stay tuned for future iterations of The Gauge as we continue to map these trends.

Take me to the methodology details below.
Watch the video to hear Brian Fuhrer, SVP, Product Strategy at Nielsen provide a behind the scenes look at some of the viewing changes underpinning The Gauge.
METHODOLOGY AND FREQUENTLY ASKED QUESTIONS
The Gauge provides a monthly macroanalysis of how consumers are accessing content across key television delivery platforms, including Broadcast, Streaming, Cable and Other sources. It also includes a breakdown of the major, individual streaming distributors. The chart itself shows the share by category and of total television usage by individual streaming distributors.
How is ‘The Gauge’ created?
The data for The Gauge is derived from two separately weighted panels and combined to create the graphic. Nielsen’s streaming data is derived from a subset of Streaming Meter-enabled TV households within the National TV panel. The linear TV sources (Broadcast and Cable), as well as total usage are based on viewing from Nielsen’s overall TV panel.
All the data is based on a specific time period for each viewing source. The data, representing a 5 week month, includes a combination of Live+7 for weeks 1 – 4 in the data time period. (Note: Live+7 includes live television viewing plus viewing up to seven days later. Live +3 includes television viewing plus viewing up to three days later.)
What is included in “Other”?
Within The Gauge, “Other” includes all other TV. This primarily includes all other tuning (unmeasured sources), unmeasured video on demand (VOD), streaming through a cable set top box, gaming, and other device (DVD playback) use. Because streaming via cable set top boxes does not credit respective streaming distributors, these are included in the “Other” category. Crediting individual streaming distributors from cable set top boxes is something Nielsen continues to pursue as we enhance our Streaming Meter technology.
What is included in “Other Streaming”?
Streaming platforms listed as “Other Streaming” includes any high-bandwidth video streaming on television that is not individually broken out.
Do you include live streaming on Hulu and YouTube?
Yes, Hulu includes viewing on Hulu Live and Youtube includes viewing on Youtube TV.
Encoded Live TV, aka encoded linear streaming, is included in both the Broadcast and Cable groups (linear TV) as well as under Streaming and other streaming e.g. Hulu Live, Youtube TV, Other Streaming MVPD/vMVPD apps. (Note: MVPD, or multichannel video programming distributor, is a service that provides multiple television channels. vMVPDs are distributors that aggregate linear (TV) content licensed from major programming networks and packaged together in a standalone subscription format and accessible on devices with a broadband connection.)


