Technology continues to be on the fast track—from the advent of the connected cars to recent improvements in virtual reality gear. These changes are shifting consumer behavior and influencing how people experience video content.
Today’s media and broadcasting companies are advancing with this rapid change in order to find their best consumers. So while live TV remains the driving engine to deliver content to consumers, broadcasters are diversifying their content distribution and leveraging a multitude of new, digital platforms to reach viewers.
According to the latest Local Watch Report, time-shifted TV use increased in 12 of the top 25 local people meter (LPM) markets in the first quarter of 2016—with viewers averaging more than 45 minutes a day. Usage of multimedia devices—Roku, Google Chromecast and Apple TV—also grew, with more than half of the LPM markets logging 15 minutes or more of usage per day. Still, live TV remains strong. Cleveland, Pittsburgh and Baltimore rank among the top four markets for total TV and average more than four hours and 30 minutes of live TV viewing.
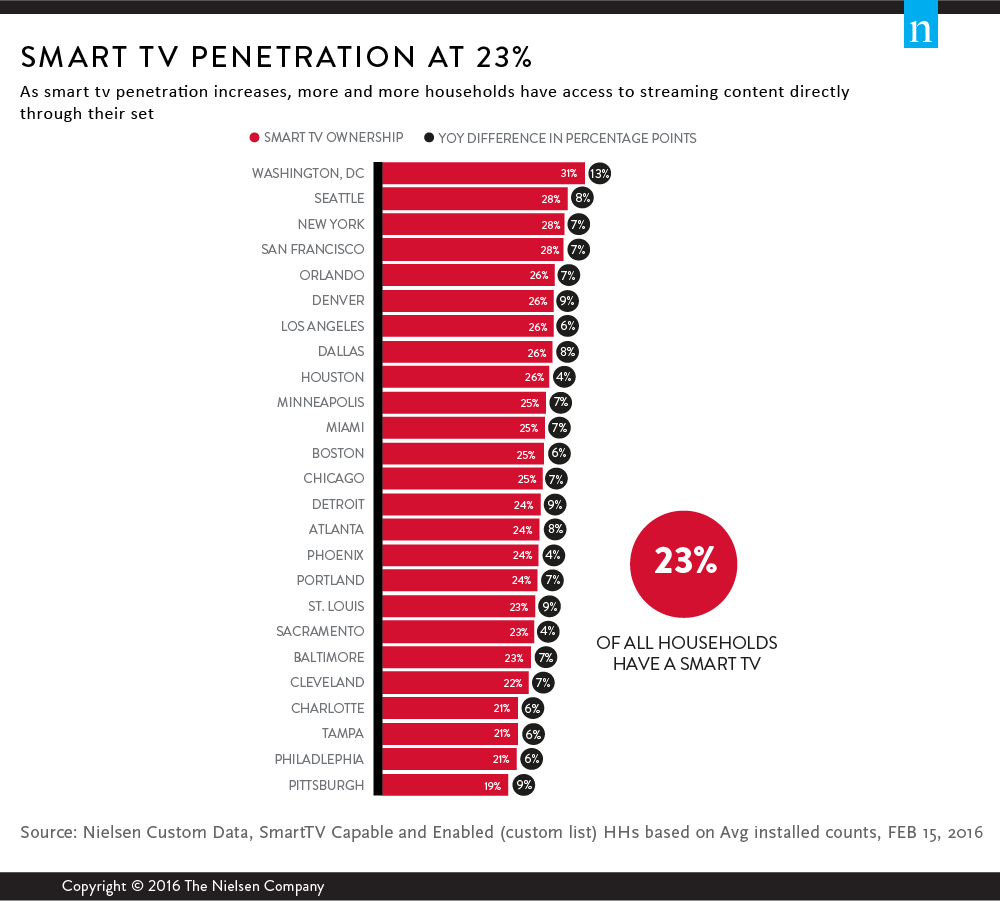
Not only has the information superhighway allowed for this growth, it has also made technology smarter, quite literally. The report found that more Americans are purchasing smart TVs, with nearly a quarter of U.S. homes now owning one. Tech-savvy hubs like Washington, D.C., Seattle and New York lead the country in smart TV ownership, while other LPM markets like Denver, Detroit, St. Louis and Pittsburgh experienced 9% growth in smart TV penetration since last year. Consumers also increasingly own technology such as smartphones (86%) and tablets (58%).
All this technology is helping today’s digital-savvy shoppers. And perhaps no shopper does more homework and is savvier than a buyer in the market for a car.
MEDIA TOUCHPOINTS OF DIGITAL AUTO SHOPPERS
Shopping for a new car online was not what Henry Ford, the Dodge brothers or Karl Benz had in mind when they revolutionized the automobile industry, but they’d probably be happy with the amount of consumers that have access to view their products. Today, more than 64 million Americans, or 26% of U.S. adults, use the Internet for automotive research—over a quarter of the U.S. population! At 32%, Houston and Minneapolis are home to the highest concentration of digital car shoppers.
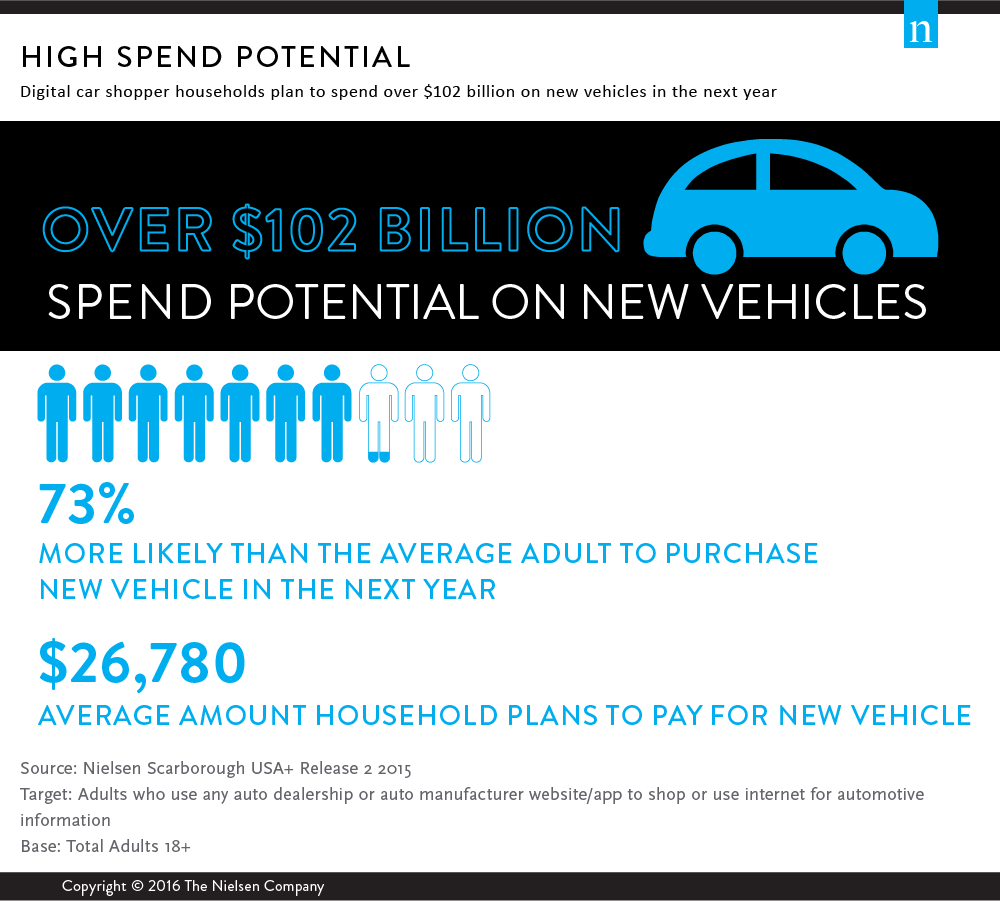
Digital car shoppers mean big money for dealerships, as they’re 73% more likely than the average American to purchase a new vehicle in the next 12 months. On average, digital shopper households plan to spend $26,780 for a new vehicle. Together, that means this group plans to spend more than $102 billion on new vehicles in the next year. And nearly a third of these shoppers have an annual income in of $100,000 or more.
To take advantage of this tremendous opportunity, it’s critical to understand who digital auto shoppers are, their car buying preferences and their path to purchase.
Digital auto shoppers are younger than the general population—71% are Millennials (persons 18-34 years old) and Generation X (persons 35-54 years old). In addition, more than half of these shoppers heading online to look for cars are men (58%), and 41% have a child in the household.
As a result, 75% say safety is a key attribute they look for when considering a new purchase, and 66% say completing comprehensive research is important before making their final decision. Given the fact that these shoppers are tech-savvy, it’s not surprising that they also seek technological advances in new vehicles. Having a robust and informative digital presence that highlights the features of different vehicles may help local car dealers who want to attract prospective buyers.
Passing down a car from generation to generation has been a tradition that has built brand loyalty. However, today’s digital shoppers say they’re motivated by incentives and rebates when making their purchase decision. As a result, these spend-ready consumers’ are more likely than the average U.S. adult to look for the following three things when visiting a local dealership: selection, price and financing.
The good news for local dealerships is that 36% of these spend-ready consumers drove 20 miles or less to purchase or lease their last vehicle. So how can local dealers reach these eager shoppers? Insights from the report show that local news is important to digital auto shoppers—64% say they typically watch local news and 62% of them tend to use the Internet for local news monthly.
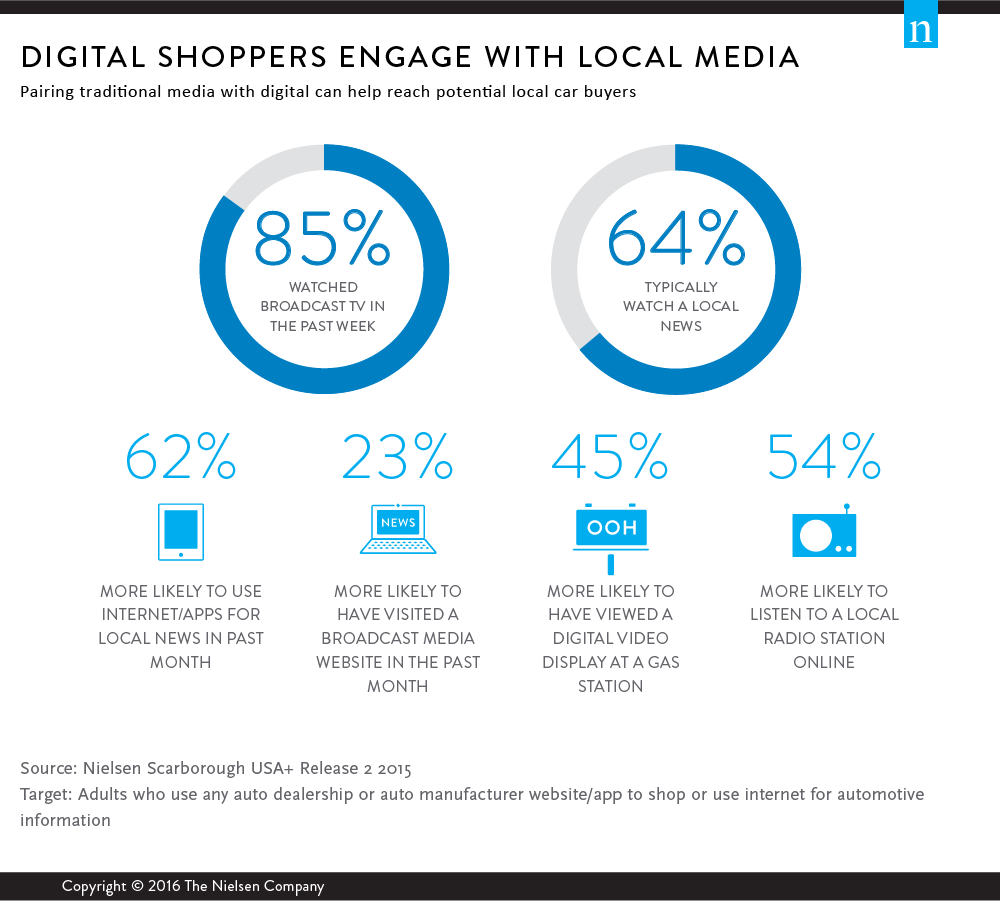
As a result of technological advances, decisions like shopping for a vehicle have become more complex, even as consumers have become more informed prior to visiting a dealership. And while the media landscape has become more fragmented and viewing options have increased, live TV continues to be an effective medium to reach digital auto shoppers. Nonetheless, as local dealerships look to engage with this highly lucrative consumer, it’s critical to understand their media consumption habits—and pairing traditional and digital media can result in a competitive advantage.
For more information, download the Q1 2016 Local Watch report.
Methodology
The insights from this article are derived from various services including Nielsen Local TV View (NLTV), NPOWER Nielsen Custom Data, Mobile Insights and Nielsen Scarborough USA+.
- NLTV provided insights regarding the overall average time spent per day in the top LPM and Set-Meter markets. The surveys took place in February 2016 and focused on persons 25-54.
- Nielsen Custom List was used for insights regarding smart TV capable and enabled households. The data reflects household average install counts based on Feb. 15, 2016.
- Nielsen Custom List was leveraged to survey installed count of homes with access to a SVOD service. Data reflects household average install counts based on Feb. 15, 2016. Broadband only homes excluded from local markets.
- Nielsen Custom List was leveraged to survey installed count of homes with at least one tablet. The data reflects household AVG installed count percentage base on February 2016 versus February 2015. Broadband only homes excluded from local markets.
- Mobile Insights analyzed smartphone penetration for persons 13+ during February 2016 versus February 2015.