Every year as January comes to a close, sports fans, brands and consumers across America are preparing for one of the biggest sporting events of the year: the Super Bowl. On Sunday, Feb. 4, the Philadelphia Eagles will take on the New England Patriots, and while the teams are practicing before the big game, consumers around the country are putting their game faces on.
Tuning Into the Game—And A Wider Reach of Consumers
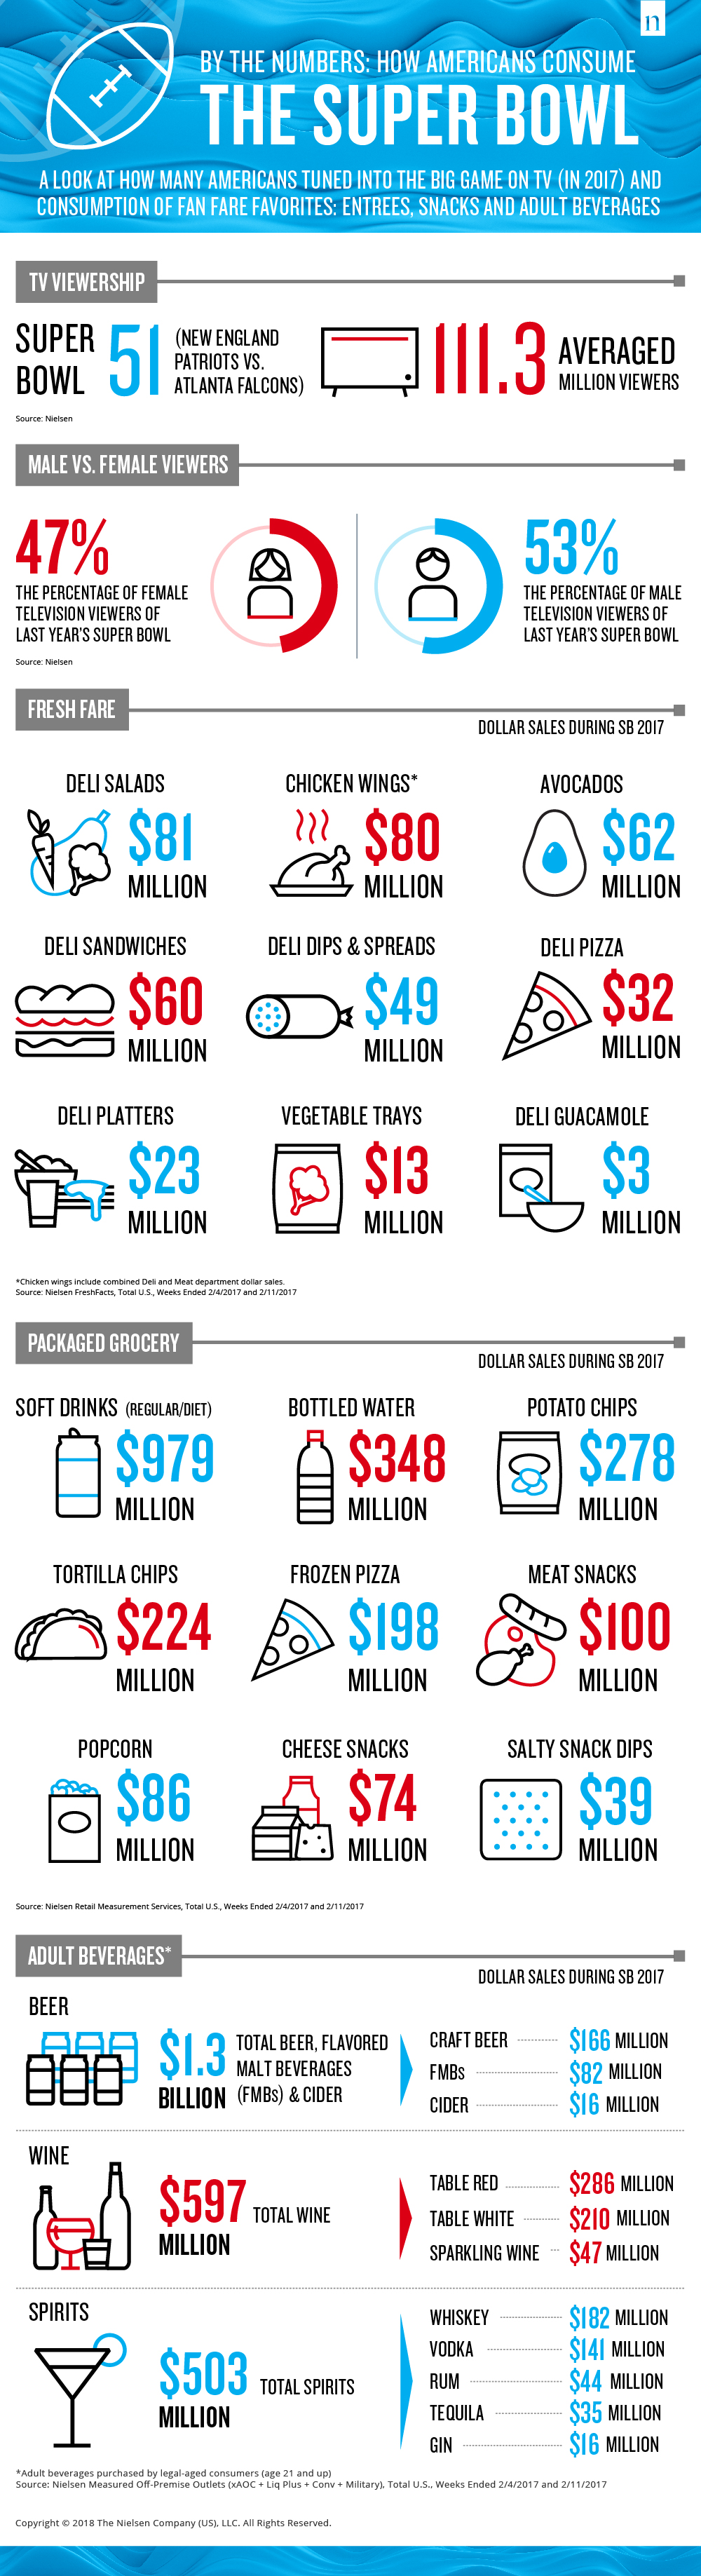
Last year, more than 111.3 million viewers tuned into the Super Bowl—and it’s no longer just a man’s game. Viewership among men and women was nearly equal last year (53% and 47%, respectively). For brands, this creates a huge opportunity to showcase new products that appeal across genders—and cultures, too. According to Nielsen Scarborough research, 12% of Hispanics and 11% of African Americans watched or listened to the game last year.
12% of Hispanics and 11% of African Americans watched or listened to the Super Bowl last year
Eating & Drinking: It’s in the Game
But it’s not just the fans that get excited in the weeks leading up to the Super Bowl. Retailers do, too, as shoppers stock up on all their favorite food and drinks. Items like chicken wings, deli dips and spreads, salty snacks, potato chips and soft drinks rake in millions of dollars in the two weeks leading up to the Super Bowl.
Looking at beverages, there’s huge growth beyond soft drinks and bottled water, which are in a league of their own leading up to the game. Beer isn’t the only player in town: wine and spirits both generate nearly half a billion dollars in sales, each, in the two weeks leading up to the Super Bowl. According to Nielsen Scarborough data, 59% of Super Bowl fans said they prefer to drink wine, while 55% prefer beer and 49% prefer spirits.
59% of Super Bowl fans say they prefer to drink wine, 55% prefer beer and 49% prefer spirits
The infographic below highlights how viewers tuned in and sales of America’s most loved fan fare items.