The television set has always been a magnet within the home that brings friends and family together to enjoy entertainment and each other’s company. That remains true today, yet the physical TV set has become much more than a window into traditional programming. Live, scheduled TV viewing remains a fixture in our media diets, but streaming is on pace to account for one-third of consumers’ total TV time in the U.S. by the end of this year.
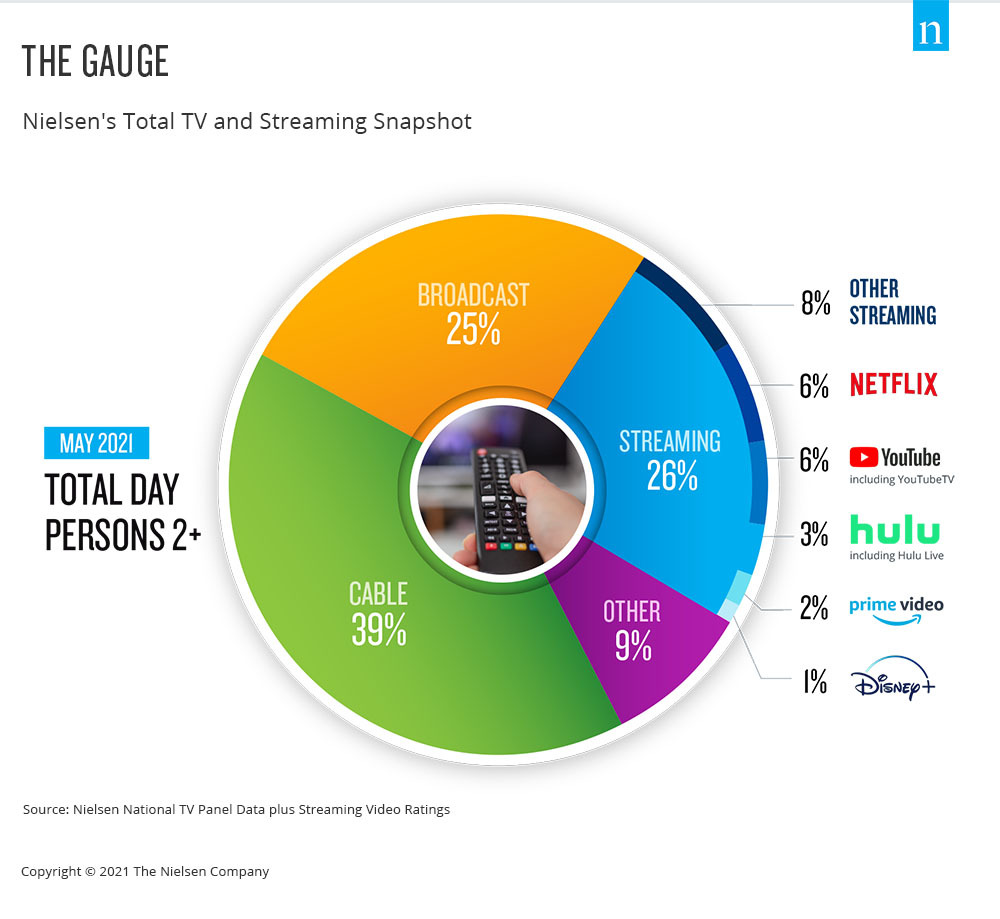
Few areas of the media landscape have been in focus over the past year as streaming video content has, and the TV set is a key portal for that engagement. There is no shortage of news and hype about the streaming landscape, as well as how streaming engagement has dramatically altered video viewing, as it now accounts for 26% of total TV usage. While that statistic is telling on its own, it doesn’t contextualize streaming usage within the broader usage of TV.
From a media industry perspective, nothing is more valuable than accurate, comparable data. And as audiences no longer see a difference between traditional TV, streaming and digital, measurement shouldn’t either. That’s where the Gauge, Nielsen’s total TV and streaming snapshot, comes in. This important step forward in the journey toward true cross-platform measurement and Nielsen ONE simplifies TV usage, illustrating television consumption behavior in a single graphic. With this view, to be updated monthly, industry participants will be able to see critical behavioral shifts and consumer trends with respect to total TV viewing. Additionally, the Gauge tracks “other” use of the TV, such as via game consoles, to give an accurate view of what people are doing in their dens and living rooms.
Importantly, the Gauge does more than simply chart streaming behavior within U.S. homes that have the ability to stream. The snapshot represents streaming across all television homes, which means that the share of streaming more accurately represents consumer behavior in a way that’s easy to describe and understand. The new representation also shows select streaming distributor shares against the total television universe so it provides better comparability within television usage.
Tracking the growth of streaming consumption—and viewing it alongside other TV usage—is critical as studios, networks, advertisers, agencies and industry groups seek clarity around the various video content that consumers engage with.
Nielsen’s approach to audience measurement, which leverages a geographically representative panel of real people and big data, is built for the future of media consumption. And with the Gauge, the future of TV consumption is visible in a single view.
For more information visit The Gauge.
Methodology
- Streaming via cable set top boxes does not credit to the respective streaming distributors, but instead is included in the “all other” group.
- Data used is derived from two separately weighted panels and combined to create the infographic. Streaming data comes from a subset of TV households in the national TV panel that are enabled with the streaming meter, while linear sources as well as total usage are based on viewing from the overall TV panel.
- Encoded linear streaming is reflected in both the linear (broadcast, cable) group as well as under the respective linear streaming app (e.g., Hulu Live, YouTube TV, other streaming MVPD/vMVPD apps)
