More than seven in ten Australian households now own four or more connected devices. Our access to media, information, entertainment and each other – anywhere and anytime – means we are spreading our screen time across multiple options. Our evolving viewing patterns are heavily influenced by platform and device choice and what is available to us at any given time of day.
Despite this trend, the latest Australian Multi-Screen Report – from Regional TAM, OzTAM and Nielsen, and covering Q2 (April-June) 2016 – shows that most of our viewing still happens on a traditional TV at home. Each week, 88.1% of Australians (20.67 million people) watch at least some broadcast TV on in-home sets (free-to-air and/or subscription channels).
The way we are using our TV sets, however, is changing. Thanks to take-up of Internet-capable TVs and/or devices attached to the TV, we are using our TV sets for many things in addition to watching live broadcast television.
‘Other TV screen use’ and 8-28 day playback viewing now collectively account for 14 hours per month per Australian in prime time. Over the past several years, we have seen this growth contribute to the gradual decline seen in live TV viewing and playback within seven days.
Meanwhile ‘longer tail’ playback viewing continues to grow: 1.8% of all broadcast TV watched on in-home sets in any four-week period is time-shifted between eight and 28 days later.
BROADCAST TV VARIES BY TIME-OF-DAY, DAY-OF-WEEK AND DEVICE
Using OzTAM Video Player Measurement (VPM) Report data to compare the peaks and troughs of when people view broadcast TV material on television sets and connected devices, we see the following patterns:
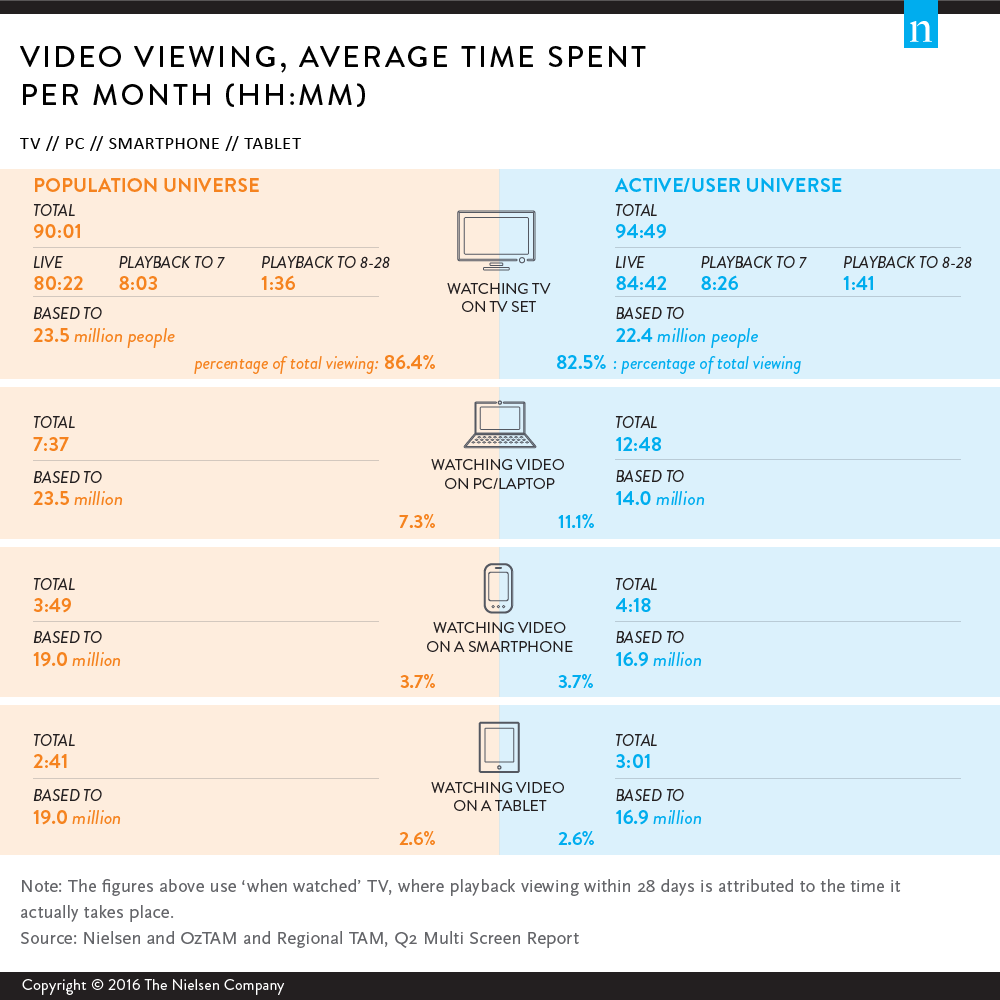
- In volume terms, watching live TV remains the dominant viewing activity.
- Among all devices there is an evening ‘peak’, reflecting the times of day at which people generally have the greatest ability to view.
- In the evenings, live viewing on TV sets begins to increase earlier and peaks earlier than playback, other TV screen use, and catch-up viewing on other connected devices.
- On weekends, this behaviour grows more quickly during the course of the day – people are more likely to be at home and have time to spend with non-portable screens.
- The late evening peak for viewing on portable devices indicates people may be taking their devices to bed with them before switching off for the night. The morning peak for phones and tablets also suggests these devices are being used in bed.
Craig Johnson, Managing Director, Media said, “There’s no denying that technology continues to transform the video experience with each passing day. With more and more devices in use within our homes, household viewing habits are evolving and expanding, offering more media touch points than ever before.”
OzTAM CEO Doug Peiffer said: “The latest Multi-Screen Report shows people using their various screens to catch up with TV content at all times of the day. This ability to move from one screen to the next and back again keeps people close to their favourite TV content. While viewing on connected devices is currently a small proportion of overall viewing, this behaviour is gaining momentum and broadcasters are smart to make their content available across all screens.”
Regional TAM Chairman and General Manager, Prime Television, Tony Hogarth said: “Regional Australians continue to watch free-to-air broadcast television on the main screen and predominantly consume the content live. Broadcast television continues to deliver strong reach and in Regional TAM markets our viewers spent on average just over 100 hours per month watching television, that is almost six hours more per month compared to the national average.”
ABOUT THE AUSTRALIAN MULTI-SCREEN REPORT
The Australian Multi-Screen Report, released quarterly, is the first and only national research into trends in video viewing in Australian homes across television, computers and mobile devices. It combines data from the three best available research sources: the OzTAM and Regional TAM television ratings panels; Nielsen Online Ratings and Nielsen’s Australian Connected Consumers report; and OzTAM’s Video Player Measurement (VPM) Report.