TV audiences continue to cut cords and embrace streaming. As of May 2023, the percentage of U.S. TV homes with cable had fallen to 46.4%1, down 12% in a single year. With significantly more choice available on streaming platforms, the appeal is clear, but the wide dispersal of content has made it cumbersome for audiences to find something to watch.
According to Nielsen’s June 2023 Streaming Content Consumer Survey, audiences now spend an average of 10-and-a-half minutes searching for something to watch, which is up from nearly seven-and-a-half minutes back in early 2019. It gets worse: 20% of audiences say they don’t know what to watch before they start looking, can’t find something to watch and then decide to do something else instead.
There are two key factors inhibiting content discovery in today’s streaming-first TV world:
- An overwhelming array of content and content sources
- Limited media metadata
Let’s dive into each of these.
Today’s video content landscape is sprawling
In just a few short years, choice and engagement with it have exploded. When Nielsen launched The Gauge in May 2021, streaming accounted for 26% of total TV usage, and only five streaming services were independently reported within it. In July 2023, streaming had grown to account for 38.7% of total TV use and 11 individual services were independently reported2. But that’s just the tip of the iceberg.
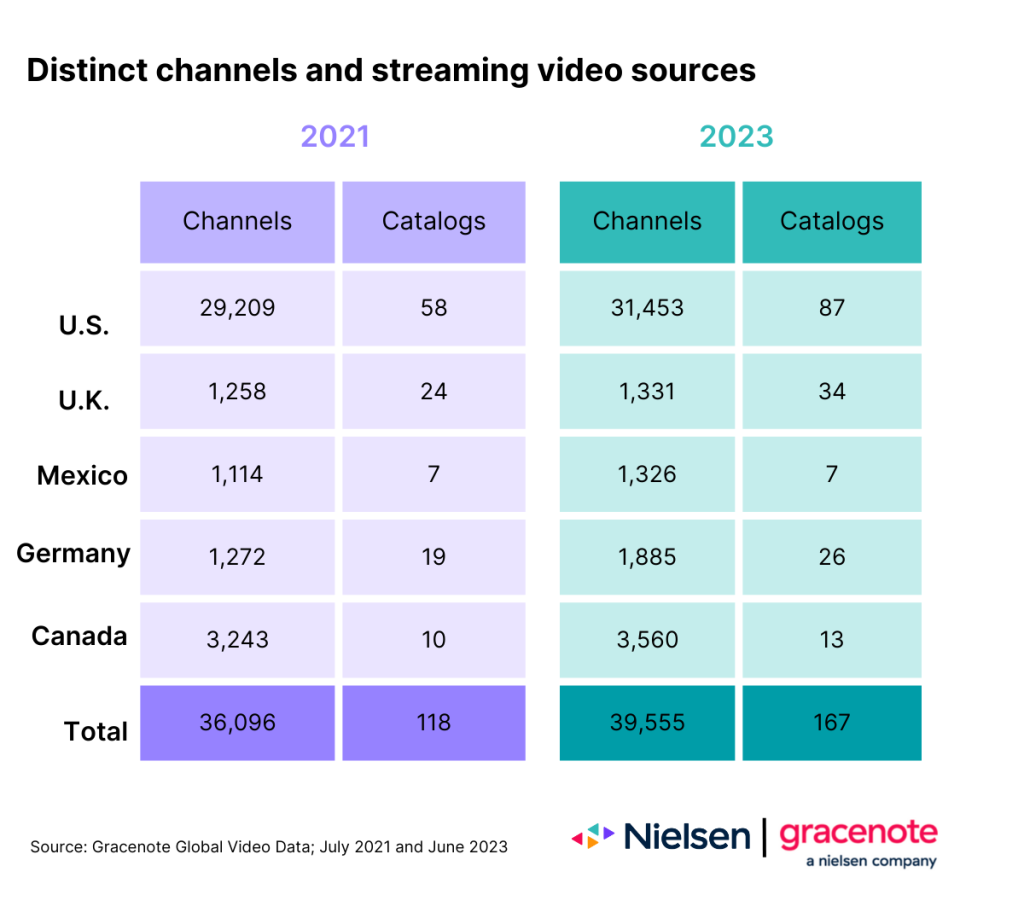
Globally, TV audiences now have more than 2.7 million individual video titles3 to choose from, and 86.7% of them are available on streaming services. There was a time when audiences had just a small handful of streaming services to choose from, but now Gracenote Global Video Data has a record of nearly 40,000 distinct channels and streaming video sources4 for audiences to choose from.
Combined, the vast array of individual video titles and streaming services that offer them have become too much for many to navigate. The audience has all the control, but if they don’t see something they like, a different option is just a click away.
Enriched metadata aids modern content discovery
When a TV show or movie was available on a specific broadcast or cable channel and scheduled at a given time, the metadata associated with it didn’t need to include much more than the program’s most basic information: title, primary cast, genre, rating, run time, etc. Amid the choice available today, this basic level of metadata isn’t capable of helping audiences find something they’re personally interested in. Just think, for example, about how many programs fall into the drama genre.
To provide audiences with the ability to have successful content discovery journeys, many creators, distributors and platforms are taking advantage of Gracenote Video Descriptors—granular metadata that provide a much more complete view of an individual TV show or movie.
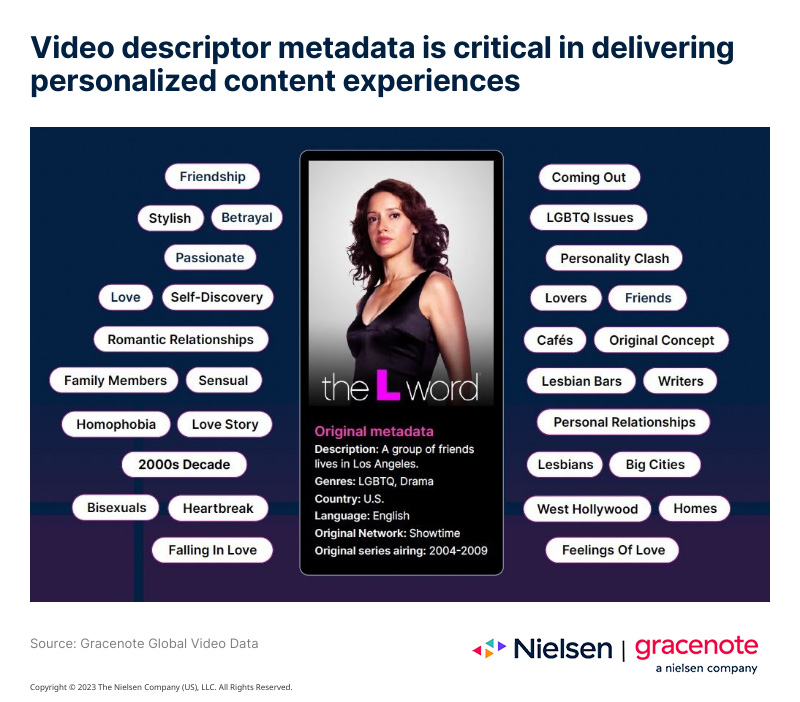
To illustrate, consider the Showtime drama series The L Word. During its original run from 2004-2009, audiences simply had to check a schedule and tune to the network to watch the program. Today, it’s one of the more than 2.3 million titles available to global streaming audiences. This reality highlights the importance of personalization and the user experience within individual services.
Available on many services globally, the 73 episodes in The L Word might not be featured in a service’s recommendation carousel or called out among the many other programs it offers. To help connect this program with viewers that might be interested in watching it, there are 31 individual descriptors that provide more nuanced, in-depth information that is supplementary to the core, foundational program information.
In addition to powering content discovery, granular metadata will be critical as content distribution moves away from exclusive license arrangements. Any service that offers the same content as a competing service will need to lean on something other than content to attract and keep audiences engaged.
While the growing range of free ad-supported television (FAST) channels largely contain content that can be found elsewhere, the trend is filtering into traditional streaming services as well. HBO, via Warner Bros. Discovery (WBD), for example, recently broke character by licensing the distribution rights to several of its high-profile original titles to Netflix—a move that followed WBD’s announced FAST partnership with Roku and Tubi involving a handful of titles that were previously exclusive to HBO.
“Right now, there are tons of experiences but very little personalization,” says Filiz Bahmanpour, VP of product at Gracenote, a Nielsen company. “Many say that FAST services will need exclusive content, original programming and marketing to succeed, but I think user experience and personalization will be the real differentiators. All streaming services, including FAST, need to get the right content and advertising to the right user through merchandising, curation and data science.”
A clear shift is underway within the streaming industry. Subscriber acquisition is no longer the key to long-term growth, especially as media research house Digital TV Research recently forecasted that global FAST and ad-supported video on-demand ad revenue will hit $109 billion by 2028. With the content landscape widening, complemented by a shift away from content exclusivity, the burden of audience engagement will continue to shift to individual platforms and services.
For additional insight, download our latest State of Play report, which focuses on the importance of data-driven personalization and streaming content discovery.
Notes
1 Nielsen National TV Panel, May 15, 2023
2 Services are independently reported once they account for at least 1% of total TV usage
3 Gracenote Global Video Data
4 As of June 2023. Each channel represents a unique source of linear programming, such as ABC and Flicks of Fury, an original channel on Pluto TV. Each streaming video source represents an individual provider, such as Netflix and Disney+.