‘Suits’ and ‘Bluey’ command 23 billion viewing minutes
With kids settled into their summer breaks in July, they continued to have an outsized effect on TV usage. While overall TV usage was up just slightly from June (0.2%), viewing among people under the age of 18 increased 4%, and viewing among adults 18 and older fell 0.3%. These trends resulted in increased streaming and “other” usage, which is primarily attributed to video game consoles.
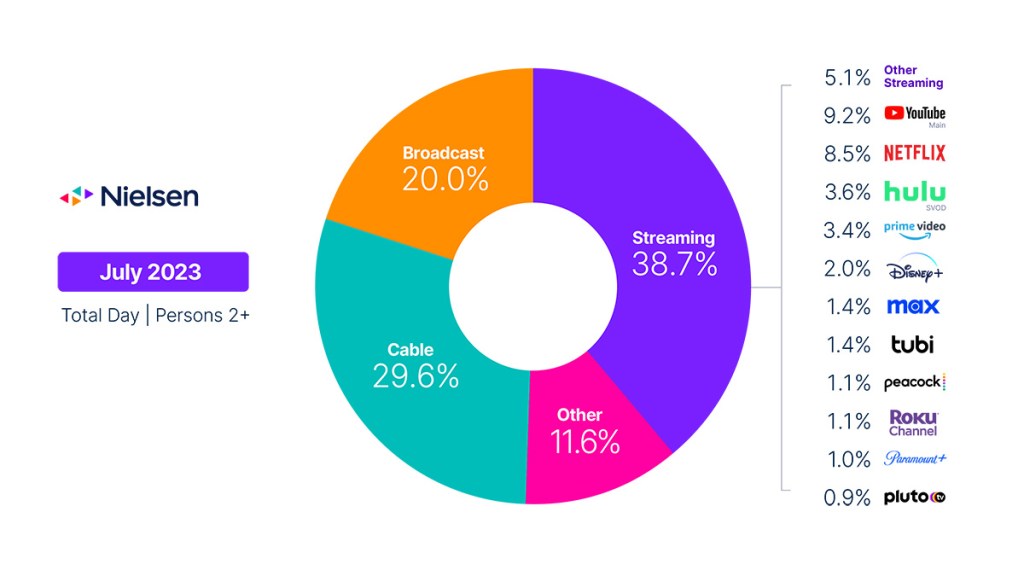
An array of new original programs arrived on streaming platforms in July, including The Witcher and The Lincoln Lawyer on Netflix, Tom Clancy’s Jack Ryan on Prime Video and The Bear on Hulu, but acquired content was the stand-out for the month. Suits, streaming on Netflix and Peacock, and Bluey on Disney+ were the most watched programs in July, accounting for 23 billion viewing minutes. Suits, however, set new viewing records for an acquired title, amassing almost 18 billion minutes. In aggregate, the heavy viewing levels pushed streaming’s share of TV to 38.7%, a new record, with Amazon Prime Video, Netflix and YouTube all hitting all-time highs.
Comparatively, sports on broadcast generated almost 25 billion viewing minutes in July, albeit across a range of channels. Most would consider July a slow month for sports, given that broadcast sports viewing typically more than triples when September starts. While the FIFA Women’s World Cup provided a boost at the end of the month, drama remained the most watched category, capturing 25.7% of viewing. Overall, total broadcast viewing was down 3.6% to finish the month at 20% of TV, representing a new low. On a year-over-year basis, broadcast usage was down 5.4%.
Cable viewing slipped as well, losing a full share point to capture 29.6% of TV in July. Feature film was the only genre to see a rise in viewership (0.5%), despite the fact that usage fell 1.5%. Viewing across virtually all others dropping from June. ESPN’s Home Run Derby and the College World Series took the top 2 slots, followed by When Calls The Heart on The Hallmark Channel. On a year-over-year basis, cable usage was down 12.5%.
The arrival of fall will likely result in a seasonal shift in TV viewing, especially with the arrival of a new NFL season. In November 2022, for example, sports accounted for 150 billion viewing minutes on broadcast. The potential for less new original primetime content this fall presents a unique situation for broadcast and cable, but the recent success of acquired programming on streaming channels highlights the outsized strength of quality content, regardless of when it was created.
July data trends with Brian Fuhrer
The Gauge provides a monthly macroanalysis of audience viewing behaviors across key television delivery platforms, including broadcast, streaming, cable and other sources. It also includes a breakdown of the major, individual streaming distributors. The chart itself represents monthly total television usage, broken out into share of viewing by category and by individual streaming distributors.
Methodology and frequently asked questions
How is ‘The Gauge’ created?
The data for The Gauge is derived from two separately weighted panels and combined to create the graphic. Nielsen’s streaming data is derived from a subset of Streaming Meter-enabled TV households within the National TV panel. The linear TV sources (broadcast and cable), as well as total usage are based on viewing from Nielsen’s overall TV panel.
All the data is time period based for each viewing source. The data, representing a broadcast month, is based on Live+7 viewing for the reporting interval (Note: Live+7 includes live television viewing plus viewing up to seven days later for linear content).
What is included in “Other”?
Within The Gauge, “Other” includes all other TV usage that does not fall into the broadcast, cable or streaming categories. This primarily includes all other tuning (unmeasured sources), unmeasured video on demand (VOD), audio streaming, gaming and other device (DVD playback) use.
Beginning with the May 2023 interval, Nielsen began utilizing Streaming Content Ratings to identify original content distributed by platforms reported in that service to reclassify content viewed via cable set top boxes. This viewing will credit to streaming and to the streaming platform which distributed it. It will also be removed from the other category, where it was previously reflected. Content not identified as original within Streaming Content Ratings and viewed through a cable set top box will still be included in other.
What is included in “other streaming”?
Streaming platforms listed as “other streaming” includes any high-bandwidth video streaming on television that is not individually broken out. Apps designed to deliver live broadcast and cable (linear) programming (VMVPD or MVPD applications like Sling TV or Charter/Spectrum) are excluded from “other streaming.”
Where does linear streaming contribute?
Linear streaming (as defined by the aggregation of viewing to vMVPD/MVPD apps) is excluded from the streaming category as the broadcast and cable content viewed through these apps credits to its respective category. This methodological change was implemented with the February 2023 interval.
What about live streaming on Hulu and YouTube?
Linear streaming via vMVPD apps (e.g., Hulu Live, YouTube TV) are excluded from the streaming category. ‘Hulu SVOD’ and ‘YouTube Main’ within the streaming category refer to the platforms’ usage without the inclusion of linear streaming.