Sports viewing increased 360% on broadcast; streaming usage slips 1.7%
Through the lens of overall TV viewing, September looked very similar to August, masking the nuances that illuminate true audience behavior. While total usage was generally flat with August, viewing behavior in September was notably unique. That uniqueness stems from changes in audience composition. With all kids and teens now back in school, for example, streaming usage dipped by double digits among school-age viewers. Comparatively, the arrival of college football and a new NFL season provided a big boost to broadcast viewing among 18-54 year olds.
Notable channel-level viewership shifts in September include:
- Broadcast viewing among 12-17 year-olds increased 26% (albeit from a small base)
- Broadcast viewing among 18-49 year-olds increased by 35%
- Broadcast viewing among 25-54 year-olds increased by almost 33%
- Streaming usage among 12-17 year-olds declined 19%
- Cable viewing among 12-17 year-olds declined 15%
Broadcast TV viewing increased almost 13% in September, bolstered by the return of college and professional football. Within broadcast, viewing of sports programming increased a whopping 360%. The important nuance one level deeper is that the biggest infusion of viewers came from younger audiences: viewing among people under 50 increased 33%, and viewing among people 25-34 increased 47%. Unsurprisingly, the top 20 telecasts involved a football game, a pre-game show or a post-game wrap up.
Sporting events were also impactful for cable, as the genre saw a 25.5% bump in viewing. ESPN carried the top 11 telecasts: 10 were football-related, and the U.S. Open took ninth place. Despite the increased sports viewing, total cable viewing slipped 1.1% from August, led by declines of 10% and 5.9% for the news and feature film genres, respectively.
Streaming viewing declined for the second month in a row, but the Suits phenomenon continued, racking up more than 8 billion minutes of viewing in September. And as it was on broadcast and cable, sports was a factor for Prime Video, which saw a 7.5% bump in viewership as a result of NFL Thursday Night Football and the second season of The Wheel of Time. With the return of TNF on Prime, the two Thursdays with games represented the highest viewing days for Prime Video. Tubi and the Roku Channel were the other two streaming services to see viewing lifts in September. And with the increase in broadcast viewing, it comes as no surprise that linear streaming climbed to represent 5.7% of TV usage—a high water mark for 2023 so far.
With limited new scripted content forthcoming in the short term, sports will remain a prime option for viewers, especially as the new NHL and NBA seasons start in October. Compared with the NFL, NHL and NBA games span broadcast and cable channels, which could play a role in TV viewing behaviors next month.
September data trends with Brian Fuhrer
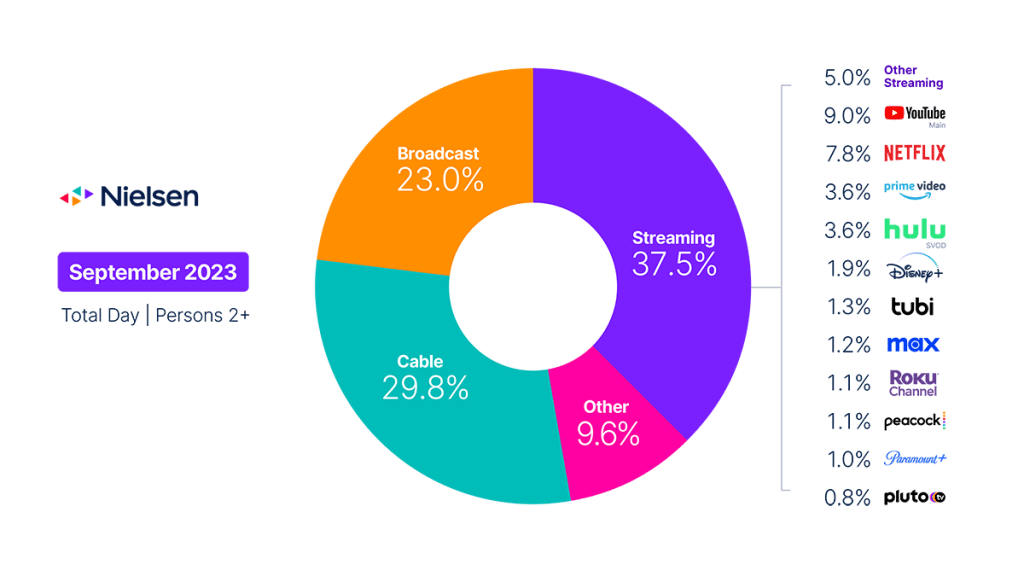
The Gauge provides a monthly macroanalysis of audience viewing behaviors across key television delivery platforms, including broadcast, streaming, cable and other sources. It also includes a breakdown of the major, individual streaming distributors. The chart itself represents monthly total television usage, broken out into share of viewing by category and by individual streaming distributors.
Methodology and frequently asked questions
How is ‘The Gauge’ created?
The data for The Gauge is derived from two separately weighted panels and combined to create the graphic. Nielsen’s streaming data is derived from a subset of Streaming Meter-enabled TV households within the National TV panel. The linear TV sources (broadcast and cable), as well as total usage are based on viewing from Nielsen’s overall TV panel.
All the data is time period based for each viewing source. The data, representing a broadcast month, is based on Live+7 viewing for the reporting interval (Note: Live+7 includes live television viewing plus viewing up to seven days later for linear content).
What is included in “other”?
Within The Gauge, “other” includes all other TV usage that does not fall into the broadcast, cable or streaming categories. This primarily includes all other tuning (unmeasured sources), unmeasured video on demand (VOD), audio streaming, gaming and other device (DVD playback) use.
Beginning with the May 2023 interval, Nielsen began utilizing Streaming Content Ratings to identify original content distributed by platforms reported in that service to reclassify content viewed via cable set top boxes. This viewing will credit to streaming and to the streaming platform which distributed it. It will also be removed from the other category, where it was previously reflected. Content not identified as original within Streaming Content Ratings and viewed through a cable set top box will still be included in other.
What is included in “other streaming”?
Streaming platforms listed as “other streaming” includes any high-bandwidth video streaming on television that is not individually broken out. Apps designed to deliver live broadcast and cable (linear) programming (VMVPD or MVPD applications like Sling TV or Charter/Spectrum) are excluded from “other streaming.”
Where does linear streaming contribute?
Linear streaming (as defined by the aggregation of viewing to vMVPD/MVPD apps) is excluded from the streaming category as the broadcast and cable content viewed through these apps credits to its respective category. This methodological change was implemented with the February 2023 interval.
What about live streaming on Hulu and YouTube?
Linear streaming via vMVPD apps (e.g., Hulu Live, YouTube TV) are excluded from the streaming category. ‘Hulu SVOD’ and ‘YouTube Main’ within the streaming category refer to the platforms’ usage without the inclusion of linear streaming.