Audiences watched 105 billion minutes of TV on New Year’s Eve
TV viewing in December continued its annual ascent to its seasonal January peak as usage increased 1.7% from November. Part of this was driven by younger audiences increasing their video game usage while away from the classroom during the winter break. That fact notwithstanding, the December interval included the day with the second-most viewing of the year (behind Super Bowl Sunday): TV viewers watched 105 billion minutes of programming on New Year’s Eve.
After four consecutive monthly gains, the broadcast category lost its momentum, as usage dipped 4.3% from November. Adults 25-34 drove the biggest declines, as they watched 13% less broadcast programming than in November. Sports remained hot, with NFL games accounting for 12 of the top 13 broadcast telecasts during the month. New Year’s Rockin’ Eve on ABC took the 13th spot. And while sports maintained the lion’s share (28.5%) of broadcast viewing, sports viewing dipped 3.5% from the previous month. The news genre was one of the few gainers, with usage increasing 6% to account for 12% share of broadcast.
With the help of a host of high-profile sporting events, cable viewing increased 1.3% from November. In fact, football games accounted for the top 14 cable telecasts, with the Dec. 30, 2023, NFL game, the Orange Bowl, the NFL Christmas Eve game and the Cotton Bowl taking the top four spots. The bevy of ball games boosted cable sports viewing by 8.4%, but the feature film genre took the biggest slice of the cable pie in December (21.4%)—nearly triple sports’ share (8.1%). Due to overall TV usage, however, cable lost 0.1 share point to finish the month with 28.2% of TV usage.
Similar to broadcast and cable, streaming remained challenged by the scarcity of new content, yet a handful of titles started to arrive, including Leave The World Behind on Netflix, which accounted for 4.5 billion viewing minutes. That title, combined with Young Sheldon, the month’s runaway program winner with 6.7 billion viewing minutes, contributed to a 5.8% increase in Netflix viewing (Young Sheldon streams on Netflix and Max). In aggregate, streaming usage was up 1.2%, but it wasn’t enough to gain share, given the increase in total TV usage. Notable platform-level changes included a 6.6% increase in Tubi viewing that led to a 0.1 share bump and a 3.4% drop in YouTube usage that led to a loss of 0.4 share points.
Despite the record-breaking football season, this was not a typical fall TV season. The scarcity of new content across the entire ecosystem will soon turn the corner, with ramped-up production expected to begin delivering new scripted programming as soon as mid-January. Yet while the abbreviated broadcast and cable seasons won’t have the awareness and promotion that comes from fall sports, the recent streaming success of Young Sheldon and Suits highlights that the success of any one program isn’t limited to its original airing.
December data trends with Brian Fuhrer
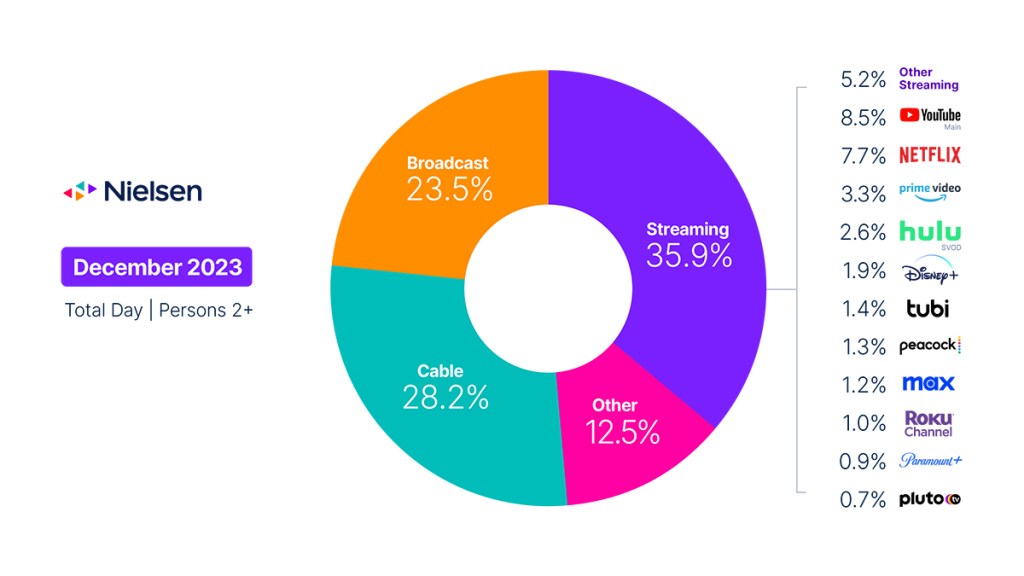
The Gauge provides a monthly macroanalysis of audience viewing behaviors across key television delivery platforms, including broadcast, streaming, cable and other sources. It also includes a breakdown of the major, individual streaming distributors. The chart itself represents monthly total television usage, broken out into share of viewing by category and by individual streaming distributors.
Methodology and frequently asked questions
How is ‘The Gauge’ created?
The data for The Gauge is derived from two separately weighted panels and combined to create the graphic. Nielsen’s streaming data is derived from a subset of Streaming Meter-enabled TV households within the National TV panel. The linear TV sources (broadcast and cable), as well as total usage are based on viewing from Nielsen’s overall TV panel.
All the data is time period based for each viewing source. The data, representing a broadcast month, is based on Live+7 viewing for the reporting interval (Note: Live+7 includes live television viewing plus viewing up to seven days later for linear content).
What is included in “other”?
Within The Gauge, “other” includes all other TV usage that does not fall into the broadcast, cable or streaming categories. This primarily includes all other tuning (unmeasured sources), unmeasured video on demand (VOD), audio streaming, gaming and other device (DVD playback) use.
Beginning with the May 2023 interval, Nielsen began utilizing Streaming Content Ratings to identify original content distributed by platforms reported in that service to reclassify content viewed via cable set top boxes. This viewing will credit to streaming and to the streaming platform which distributed it. It will also be removed from the other category, where it was previously reflected. Content not identified as original within Streaming Content Ratings and viewed through a cable set top box will still be included in other.
What is included in “other streaming”?
Streaming platforms listed as “other streaming” includes any high-bandwidth video streaming on television that is not individually broken out. Apps designed to deliver live broadcast and cable (linear) programming (vMVPD or MVPD applications like Sling TV or Charter/Spectrum) are excluded from “other streaming.”
Where does linear streaming contribute?
Linear streaming (as defined by the aggregation of viewing to vMVPD/MVPD apps) is excluded from the streaming category as the broadcast and cable content viewed through these apps credits to its respective category. This methodological change was implemented with the February 2023 interval.
What about live streaming on Hulu and YouTube?
Linear streaming via vMVPD apps (e.g., Hulu Live, YouTube TV) are excluded from the streaming category. ‘Hulu SVOD’ and ‘YouTube Main’ within the streaming category refer to the platforms’ usage without the inclusion of linear streaming.