Total TV usage increases 5.7% in November; broadcast’s share rises for fourth consecutive month
Driven by the Thanksgiving holiday week, total TV usage increased 5.7% in November, with broadcast gaining 0.3 share points to equal its share in January—both high points for the year. While TV usage was up nearly 3% during the first three weeks of the month, viewing during the fourth week, fueled by big rivalries in college football and an expanded array of NFL games, jumped 14.4% over October levels.
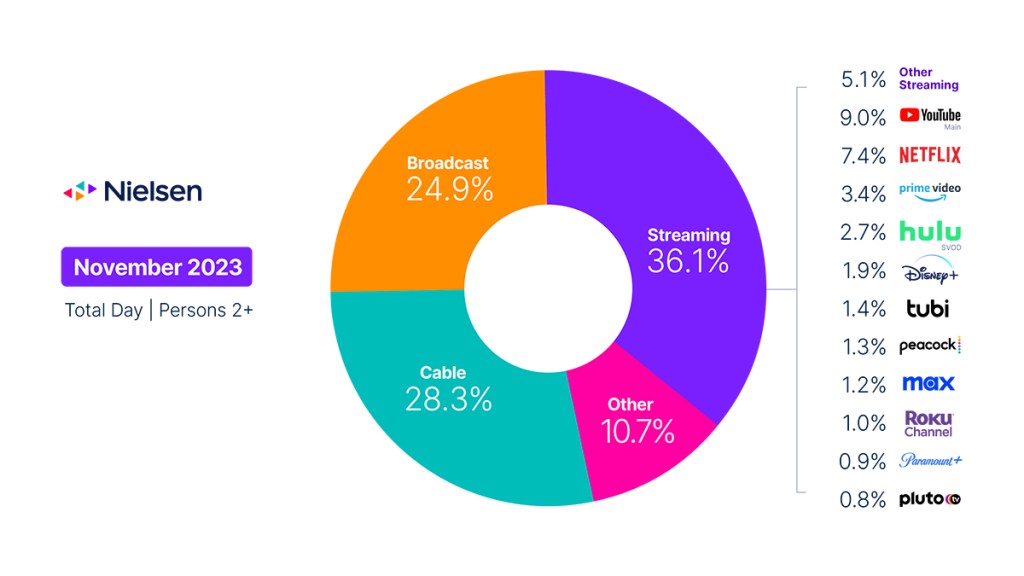
With some of the most popular football matches airing in late November, broadcast usage increased 18.4% in the last week of the month, and viewership for sports programming was up 21% from October to account for one-third of all broadcast viewing. And while overall broadcast viewing is down 5.3% on a year-over-year basis, sports viewing on broadcast channels is up 2.8%.
With football being a staple on broadcast channels in November, cable is a prime destination for holiday movies, and this year was no exception: viewing of movies was up 26% from October to account for 19% of cable viewing, making it the highest-viewed cable genre this month. Feature film viewership even surpassed the category’s typical front runner—cable news—which accounted for 18.4% of cable viewing this month. Movie viewership notwithstanding, cable gave up 1.2 share points in November as news and sports viewing slipped 0.6% and 16%, respectively.
With total TV usage up in the month, the 4.3% increase in streaming wasn’t enough to prevent a share loss of 0.5 in November. As we saw in the broadcast category, the last week of the month drove the bulk of the increase for streaming, as viewing jumped 10% during the week of Thanksgiving. Peacock was the biggest gainer, as usage increased 23% to provide a 0.2 share point gain, driven by football coverage and the Macy’s Thanksgiving Day Parade. Netflix also gained 0.2 share point as a result of an increase in usage of 8.6% to finish the month at 7.4% of TV usage. All the Light We Cannot See provided a viewing highlight in a climate with less content as a result of the writers’ strike, as audiences spent 2.1 billion minutes watching this Netflix original miniseries. Tubi and YouTube also saw usage gains, but only Tubi was able to add to its share, while YouTube’s share fell slightly as it was not enough to keep up with the increase in overall TV usage.
November data trends with Brian Fuhrer
The Gauge provides a monthly macroanalysis of audience viewing behaviors across key television delivery platforms, including broadcast, streaming, cable and other sources. It also includes a breakdown of the major, individual streaming distributors. The chart itself represents monthly total television usage, broken out into share of viewing by category and by individual streaming distributors.
Methodology and frequently asked questions
How is ‘The Gauge’ created?
The data for The Gauge is derived from two separately weighted panels and combined to create the graphic. Nielsen’s streaming data is derived from a subset of Streaming Meter-enabled TV households within the National TV panel. The linear TV sources (broadcast and cable), as well as total usage are based on viewing from Nielsen’s overall TV panel.
All the data is time period based for each viewing source. The data, representing a broadcast month, is based on Live+7 viewing for the reporting interval (Note: Live+7 includes live television viewing plus viewing up to seven days later for linear content).
What is included in “other”?
Within The Gauge, “other” includes all other TV usage that does not fall into the broadcast, cable or streaming categories. This primarily includes all other tuning (unmeasured sources), unmeasured video on demand (VOD), audio streaming, gaming and other device (DVD playback) use.
Beginning with the May 2023 interval, Nielsen began utilizing Streaming Content Ratings to identify original content distributed by platforms reported in that service to reclassify content viewed via cable set top boxes. This viewing will credit to streaming and to the streaming platform which distributed it. It will also be removed from the other category, where it was previously reflected. Content not identified as original within Streaming Content Ratings and viewed through a cable set top box will still be included in other.
What is included in “other streaming”?
Streaming platforms listed as “other streaming” includes any high-bandwidth video streaming on television that is not individually broken out. Apps designed to deliver live broadcast and cable (linear) programming (vMVPD or MVPD applications like Sling TV or Charter/Spectrum) are excluded from “other streaming.”
Where does linear streaming contribute?
Linear streaming (as defined by the aggregation of viewing to vMVPD/MVPD apps) is excluded from the streaming category as the broadcast and cable content viewed through these apps credits to its respective category. This methodological change was implemented with the February 2023 interval.
What about live streaming on Hulu and YouTube?
Linear streaming via vMVPD apps (e.g., Hulu Live, YouTube TV) are excluded from the streaming category. ‘Hulu SVOD’ and ‘YouTube Main’ within the streaming category refer to the platforms’ usage without the inclusion of linear streaming.