Sure, for now the stands might be empty, the pitch motionless and the stadium lights dim, but a sports blackout at the hands of COVID-19 hasn’t dampened the passion that many fans have in terms of their media behavior, according to a recent Nielsen analysis on sports viewing.
It’s no secret that leagues, media owners, marketers and even the athletes themselves are in a tight spot, considering global sports sponsorship deals alone represented almost a $50 billion industry last year, and 37%, or over $17 billion, were tied to deals in the U.S. according to Nielsen Sports.
Then there’s the sports-related advertising. In the TV realm, Nielsen Ad Intel solution notes that brands put almost $20 billion toward sports-related programming last year, with about $17 billion (85%) pegged to sporting events. Brands also put close to $1.2 billion toward digital advertising around sites related to sports, such as official league pages and fan sites..
But not all of that money needs to be sidelined—and it shouldn’t be. All players in the sports business should be thinking about how to maintain brand equity and awareness with sports viewers. Even though live sports are on hold, fans are hungry for content. That’s why it’s crucial that brands and sellers of media know where, how and what these consumers are viewing as a way to reach and maintain relationships with them. After all, this is the same segment that has helped live sports events rise to the top of the TV telecast charts year after year.
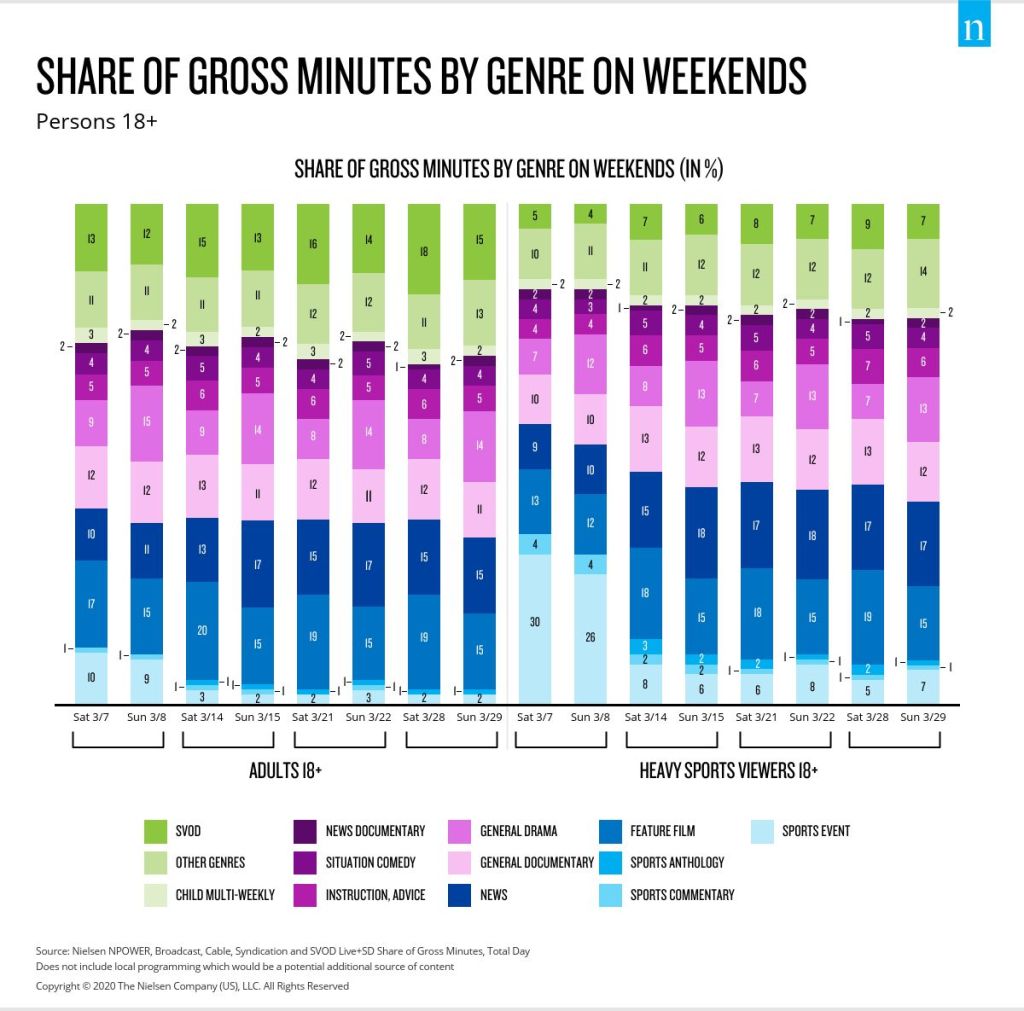
Looking back, when the NBA cancelled games starting on March 11, other sports leagues followed suit and, subsequently, a large amount of programming and viewing opportunities vanished. For instance, on March 8, the Sunday before leagues went on hiatus, 9% of U.S. adults’ overall time spent on viewing was to sports events. When the Nielsen analysis segmented out Heavy Sports Viewers (the top quintile based on live sports event viewers from Feb. 10-March 8), it found that sports events accounted for a whopping 26% of their time.
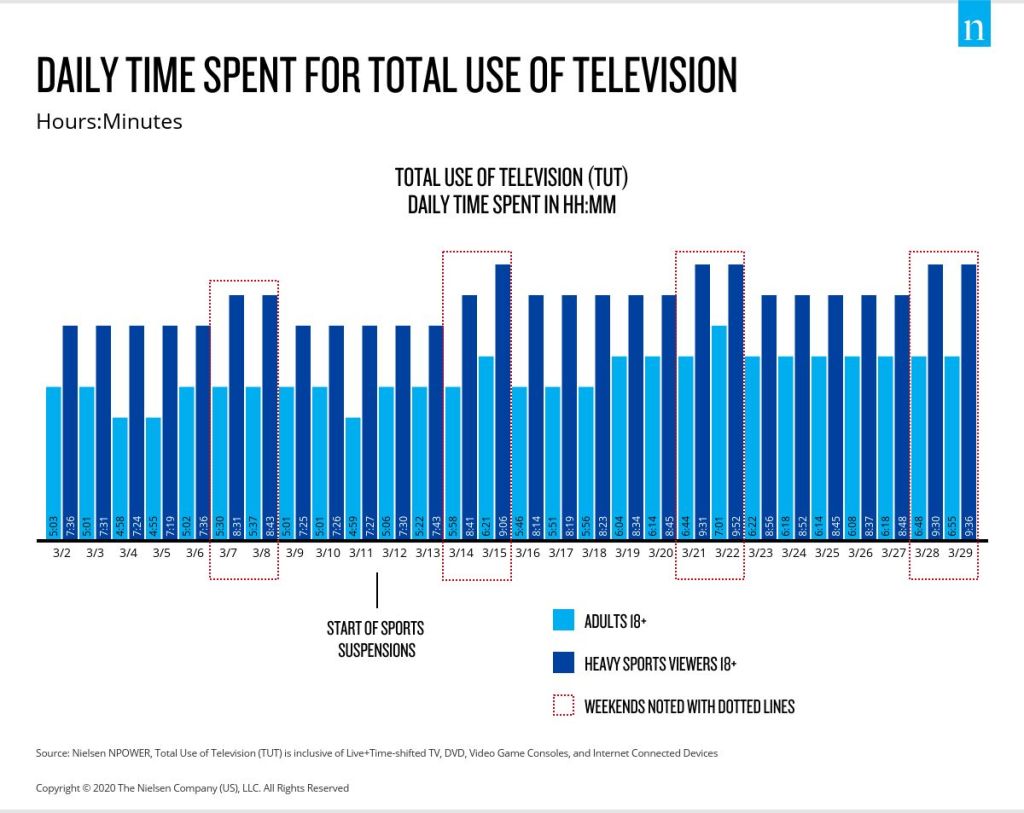
Heavy Sports Viewers, like the rest of the U.S., are watching more media in general now that they are stuck inside their apartments, abodes, condos and homes. But because this group tends to watch a lot more content than a typical viewer, their increase wasn’t as acute as the rest of the population. For example, from Sunday, March 8 through Sunday, March 29, Heavy Sports Viewers increased their viewing by 10%, while adults notched a 23% increase in their viewing.
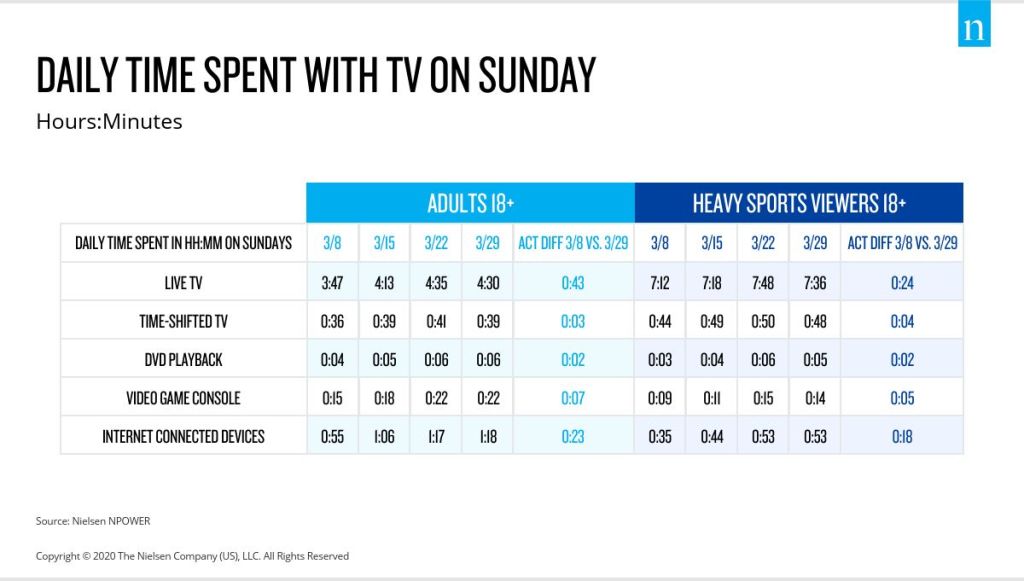
This growth—among both U.S. adults and “sports super watchers”—isn’t exclusive to traditional TV, either. It’s happening on the connected TV and devices. For instance, internet-connected devices usage (use of devices that enable streaming to the television set) alone grew almost 20 minutes a day among Heavy Sports Viewers—a more than 50% increase from three Sundays prior when the leagues were still playing and live sports events were still on the air.
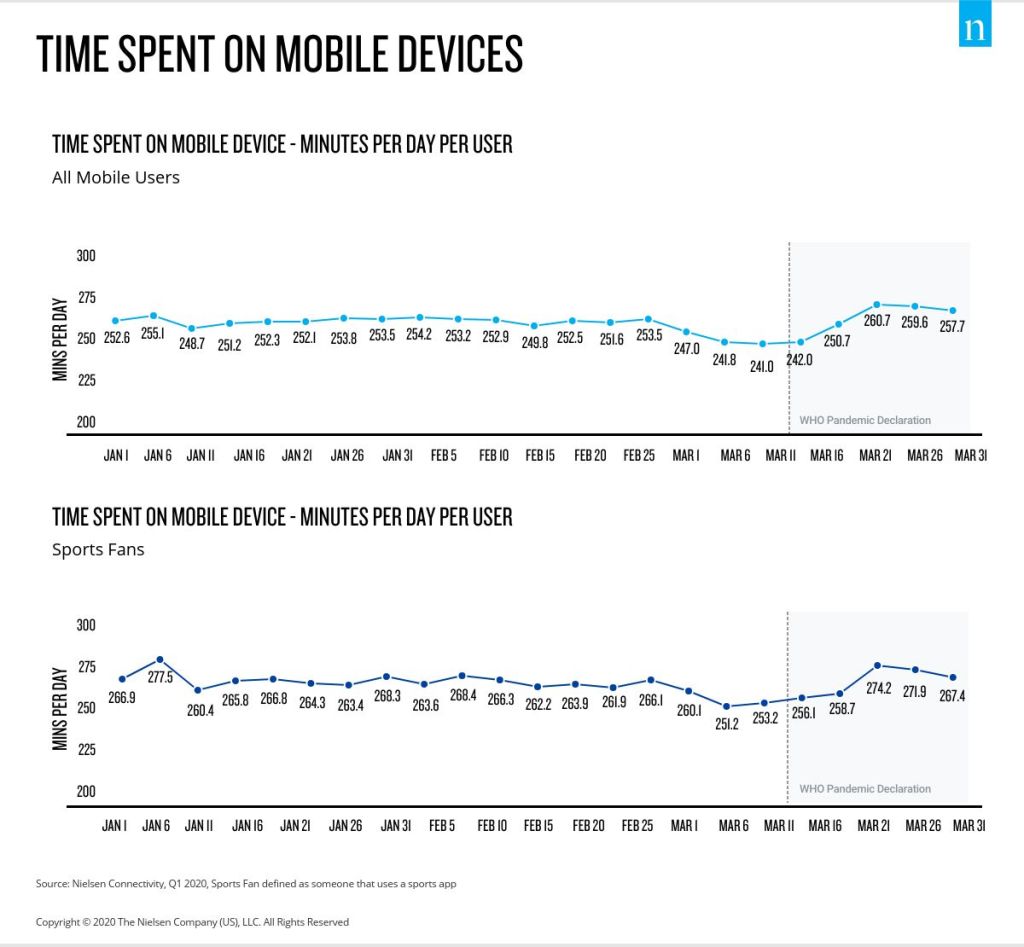
Nielsen leveraged its Connectivity Panel of 100,000 opt in Android devices for a mobile component of this analysis and found that these increases are also happening on mobile devices—even at a time when most consumers are staying put. Sports fans are typically heavier mobile app users than overall mobile apps users on a regular basis. From the time that COVID-19 was declared a pandemic on March 11, all mobile users spent more time with their mobile devices, up nearly 20 minutes per day. Among sports fans, that increase was about 15 minutes more than usual.
Mobile also experienced a shift in application usage. Not surprisingly, usage to sports-related mobile apps declined since early March about 40%, with betting and fantasy apps experiencing the largest decline.
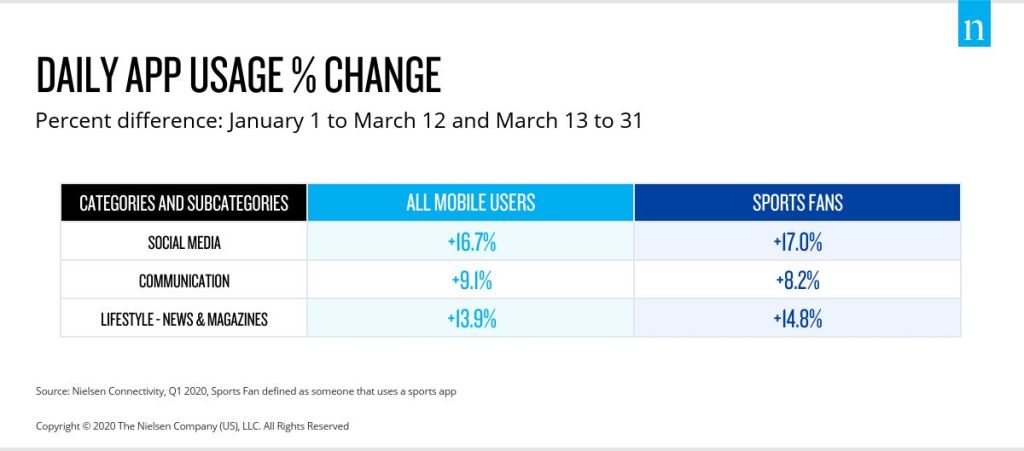
If consumers have no need for score updates or game highlights in this new viewing dynamic, it seems that keeping score on their family and friends is the next best thing. Among both overall mobile users and sports fans, the apps that saw the biggest increases were those that allow users to keep in touch with friends and family as a way to stay informed. Social Media apps had the largest gains with a 17% increase daily prior to March 12. Time spent with Communication apps (such as Zoom, Hangouts or Kik) also increased about 9% which would include both messaging apps as well as apps for video calls. News and magazine apps saw about a 14% increase as users follow the latest current events.
Beyond how much is being consumed by Heavy Sports Viewers and the types of platforms that they are consuming on, what this group is watching, sports or non, is also of particular note to media owners, buyers and brands.
So just what are they watching?
The analysis leveraged Nielsen’s national panel and looked at television programming on weekends during March and found that news is making up a larger share of consumers’ viewing time as they seek to stay up to date on the pandemic. Also, more time is being spent watching feature films, which is even more prominent among Heavy Sports Viewers. And of course, subscription video on demand (SVOD) programming is also making up a larger share of viewing among these adults. In fact, Heavy Sports Viewers nearly doubled their viewing to SVOD programming from Saturday, March 7th to Saturday, March 28th to 9% of their time.
But Heavy Sports Viewers are not so quick to give up on finding fodder to replace and satiate their lust for live sports!
In fact, among these Heavy Sports Viewers, sports programming still accounts for about one-tenth of their time on Sundays despite the suspension of live sports. Seems like reruns of Larry Bird highlight games, Pittsburgh Pirates World Series runs or Mets classics are sufficing a bit even if they come with obvious spoilers. So, despite the cancellation of live sports, these passionate TV viewers continue to find sports content to watch and enjoy and brands should consider this viewing before going dark on them as well, less they potentially undermine any equity they have built over the prior months or years.
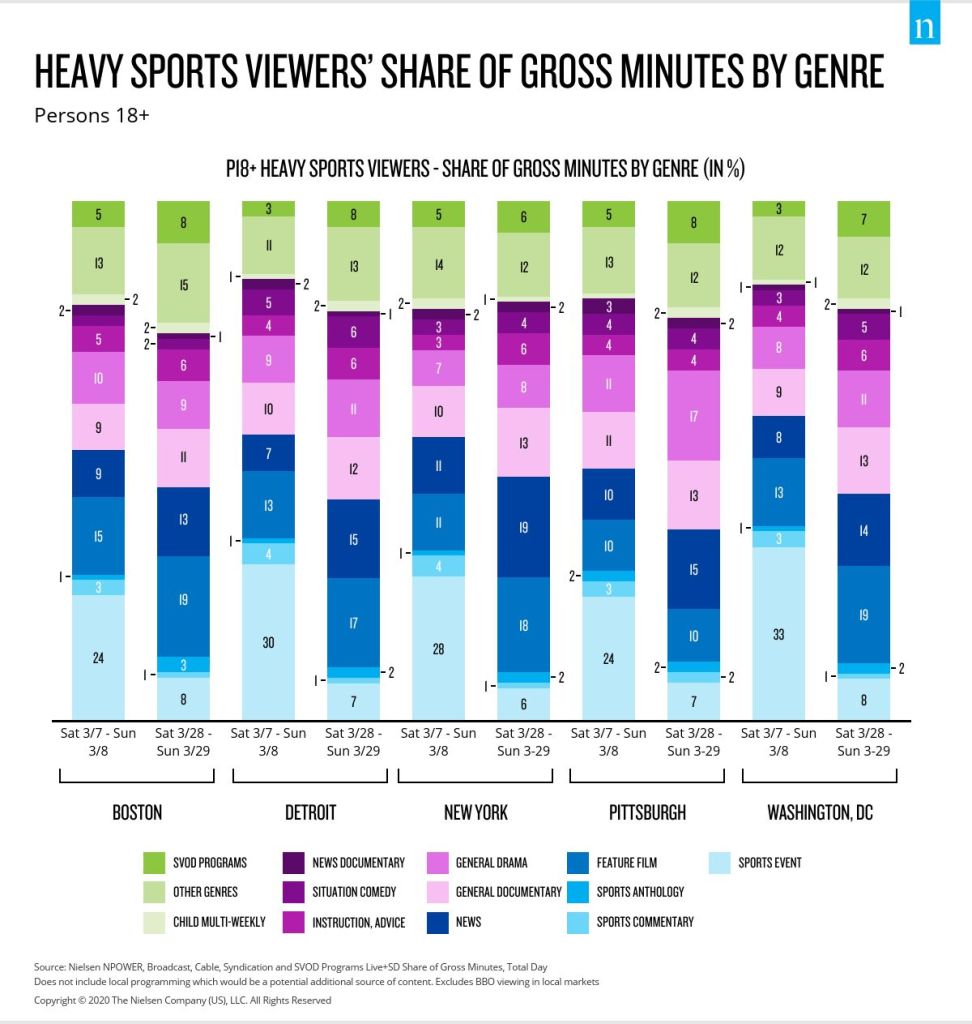
Breaking this down at a local level, as COVID-19 has made unfortunate inroads in different regions at different times, this story remained consistent. Looking at the weekend of March 7th as compared to the weekend of March 28th for a handful of afflicted markets, the shift in viewing preferences were similar among Heavy Sports Viewers.
Further, while there has been a lack of live televised sports events, the analysis uncovered that in certain markets, Heavy Sports Viewers continue to seek sports-related content following the suspension of the leagues—especially of note because these regions are known for passionate sports fans in general. In Boston, 12% of the total time viewing by Heavy Sports Viewers is spent on watching sports-related content, followed by Pittsburgh and Washington, DC, (11%) and Detroit and New York City (10%).
Leagues and programmers can also keep consumer continuity and help engage viewers while maintaining brand momentum, and perhaps even build some equity, by thinking outside the pandemic penalty box as it were. When NASCAR moved its series from the gasoline-vapored pavement to a virtual experience, they lured talent out of retirement and drove, literally, both ratings and social buzz. They also exposed new fans to both the sport and the huge amount of branding that goes along with it.
As consumers get used to a new normal, and that may change definitionally after the pandemic is over, so too must media owners and marketers and that means using the best data possible as a way to find and interface with these consumers no matter what the circumstances are, where they are or what device they are watching content on.
