The lead up to fall is always a transitional period for the TV calendar, and this August was no different. The arrival of a new school year and NFL preseason football, complemented by televised debates and the news cycle related to the upcoming presidential election, had a mixed effect across the TV options. Viewing among kids 2-17 dropped, most of which affected streaming usage, while 85% of the gains across cable were driven by viewers 65 and older.
Broadcast and cable viewing increased in August, posting gains of 1.6% and 1.7%, respectively. Broadcast, which experienced its first usage gain since January, benefited from increased “participation variety” (e.g., America’s Got Talent) and “general variety” (e.g., Big Brother) viewing to balance the steady news and drama genres, which accounted for 16.9% and 24.8% of viewing, respectively. Comparatively, the start of the NFL preseason and the arrival of the first presidential debate fueled viewing gains across cable, with sports and news accounting for 6.7% and 20.8% of viewing in August, respectively.
Streaming usage remained strong in August, but the return to school had an oversized effect on the 1.6% monthly dip in usage: Approximately 80% was due to decreased usage among viewers 2-17. Despite the drop in usage among kids, Disney+ had the third- and fourth-most watched titles: Bluey and Guardians of the Galaxy Vol. 3, with 4.2 billion and 3.2 billion minutes, respectively. The top two titles, Suits and The Lincoln Lawyer, remained strong, but not strong enough to offset a 4.8% drop in usage on Netflix. Peacock, which also carries Suits, was the biggest gainer, with usage rising 8.3% as a result of events like WWE SummerSlam, shared coverage of the NFL Hall of Fame Game and the success of The Super Mario Brothers Movie. While not included in the streaming category, linear streaming represented 5.1% of TV usage in August (please refer to the methodology for more information).
Despite its current stronghold with viewers, streaming platforms will see more competition in September as both the MLB playoff race narrows, and broadcast and cable benefit from broader coverage of new NCAA and NFL football seasons. With new scripted content in shorter supply this fall, it will be interesting to see how audiences navigate what remains a very vast and expanding TV landscape.
August data trends with Brian Fuhrer
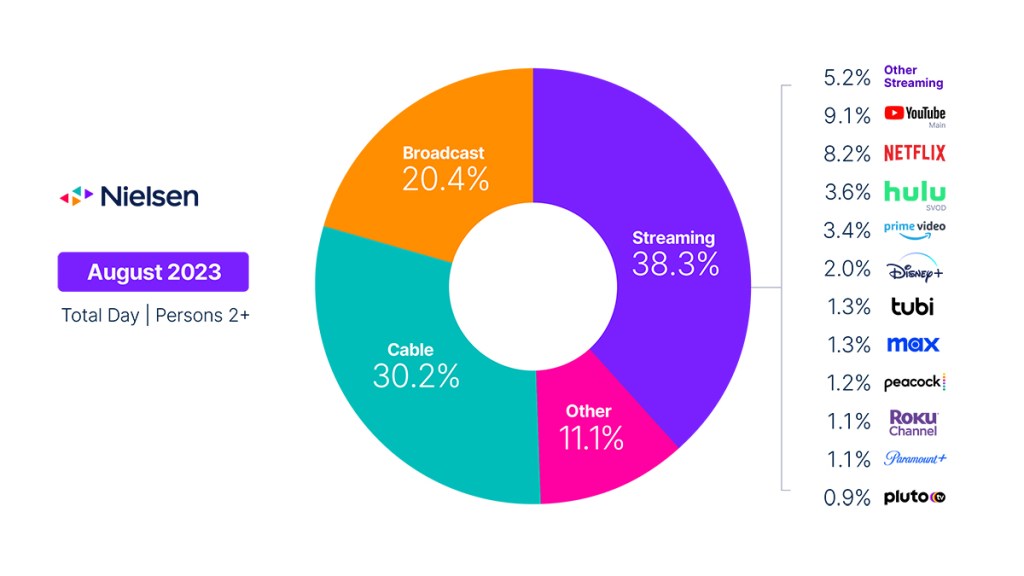
The Gauge provides a monthly macroanalysis of audience viewing behaviors across key television delivery platforms, including broadcast, streaming, cable and other sources. It also includes a breakdown of the major, individual streaming distributors. The chart itself represents monthly total television usage, broken out into share of viewing by category and by individual streaming distributors.
Methodology and frequently asked questions
How is ‘The Gauge’ created?
The data for The Gauge is derived from two separately weighted panels and combined to create the graphic. Nielsen’s streaming data is derived from a subset of Streaming Meter-enabled TV households within the National TV panel. The linear TV sources (broadcast and cable), as well as total usage are based on viewing from Nielsen’s overall TV panel.
All the data is time period based for each viewing source. The data, representing a broadcast month, is based on Live+7 viewing for the reporting interval (Note: Live+7 includes live television viewing plus viewing up to seven days later for linear content).
What is included in “other”?
Within The Gauge, “other” includes all other TV usage that does not fall into the broadcast, cable or streaming categories. This primarily includes all other tuning (unmeasured sources), unmeasured video on demand (VOD), audio streaming, gaming and other device (DVD playback) use.
Beginning with the May 2023 interval, Nielsen began utilizing Streaming Content Ratings to identify original content distributed by platforms reported in that service to reclassify content viewed via cable set top boxes. This viewing will credit to streaming and to the streaming platform which distributed it. It will also be removed from the other category, where it was previously reflected. Content not identified as original within Streaming Content Ratings and viewed through a cable set top box will still be included in other.
What is included in “other streaming”?
Streaming platforms listed as “other streaming” includes any high-bandwidth video streaming on television that is not individually broken out. Apps designed to deliver live broadcast and cable (linear) programming (VMVPD or MVPD applications like Sling TV or Charter/Spectrum) are excluded from “other streaming.”
Where does linear streaming contribute?
Linear streaming (as defined by the aggregation of viewing to vMVPD/MVPD apps) is excluded from the streaming category as the broadcast and cable content viewed through these apps credits to its respective category. This methodological change was implemented with the February 2023 interval.
What about live streaming on Hulu and YouTube?
Linear streaming via vMVPD apps (e.g., Hulu Live, YouTube TV) are excluded from the streaming category. ‘Hulu SVOD’ and ‘YouTube Main’ within the streaming category refer to the platforms’ usage without the inclusion of linear streaming.