Audiences Watched Over 103 Billion Minutes of TV on Thanksgiving Day
NFL Games Drive Broadcast Sports to Record High TV Usage, Fuel Double-Digit Growth For Multi-Platform Distributors on Peacock and Paramount+
November Yields Five of Top 10 Most Streamed Days on Record, and 10th Best Day for Broadcast Viewership in Gauge History
‘Stranger Things’ Generates Nearly 12 Billion Viewing Minutes on Netflix as November’s Most-Streamed Title, Equivalent to More than 22,000 Years of Viewing
NEW YORK – December 16, 2025 – November 2025 delivered one of the most historic months to date in Nielsen’s report of The Gauge™, the media industry’s leading snapshot of total TV and streaming consumption. The five-week reporting interval produced a 5.5% monthly increase in television usage, with live sports driving broadcast to its best share of TV since last November, while simultaneously fueling double-digit growth for hybrid streamers like Peacock and Paramount+.
Thanksgiving Day is the centerpiece of November television viewing, and this year was no exception, as audiences watched 103.4 billion minutes of TV across the day and highlighted the various viewing behavior trends. Linear streaming* on Thanksgiving represented 10.1% of total TV usage to achieve the second-highest level of daily linear streaming ever, surpassed only by Super Bowl Sunday in February 2025. By comparison, linear streaming totaled 7.8% of TV usage across the month. Additionally, Thanksgiving was the broadcast category’s 10th-most-watched day since the inception of The Gauge in May 2021.
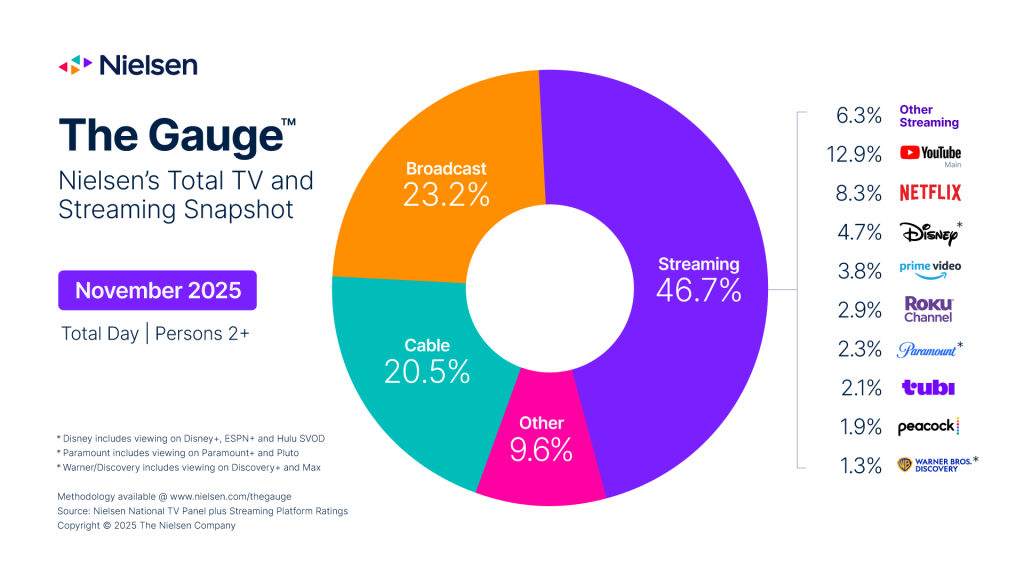
Broadcast extended its momentum in November, with viewership increasing 7% versus October to capture 23.2% of TV and outpace cable for a third consecutive month. Broadcast gains were driven overwhelmingly by a 30% monthly increase in sports viewing, specifically from the back-half of the MLB World Series on FOX, plus NFL and college football on ABC, CBS, FOX and NBC. And despite accounting for just 3% of broadcast content by duration, sports commanded 37% of all broadcast viewership in November and 6.4% of total TV usage—the highest share for the genre ever recorded in The Gauge. NFL coverage drew more younger audiences into the broadcast ecosystem as well, with viewing for the under-30 group up 21% this month, and viewing for kids 2-11 up 27%.
The sports effect was just as potent in streaming, as multi-platform distributors continued to demonstrate how live sports are fueling a unified viewership ecosystem:
- Peacock posted the strongest monthly growth among streaming platforms in November, soaring 22% on the strength of its NFL Sunday Night Football coverage and Thanksgiving Day programming. Peacock’s Thanksgiving featured simulcasts of NBC’s Macy’s Thanksgiving Day Parade and a primetime NFL game, the platform averaged 2.4 million viewers across the day, trailing only YouTube and Netflix (compared to individual platform totals). Peacock also benefited from new original drama series All Her Fault, which generated 2.4 billion minutes. The overall impact lifted Peacock to a non-Olympic record 1.9% share of television (+0.3 pts.).
- Paramount+ (within Paramount Streaming) jumped 18.4% month over month, driven by NFL games alongside the return of its original series Landman. These gains lifted the combined Paramount Streaming portfolio to a 2.3% share of television (+0.2 pts.).
In addition to live sports, November also exhibited a striking example of broadcast and streaming convergence. The Thanksgiving Day NFL matchup between the Chiefs and Cowboys on CBS generated 11.7 billion viewing minutes and was the top broadcast telecast of the month. Meanwhile, Stranger Things on Netflix totaled 11.8 billion viewing minutes across the entire month. Despite being viewed live versus on-demand, the end results were nearly identical as each accounted for more than 22,000 years of cumulative television viewing by U.S. audiences.
Overall, streaming usage grew 8% in November and captured 46.7% of total TV watch-time. This month also featured five of the top ten most-streamed days ever recorded, led by Saturday, November 29, which now ranks second all-time with 47.6 billion minutes streamed, behind the 51 billion minutes clocked on Christmas Day 2024. Most impactful to the overall November streaming landscape, however, was Netflix’s Stranger Things, whose nearly 12 billion viewing minutes propelled Netflix to a 10% monthly increase, adding 0.3 share points to finish with 8.3% of total TV. The Roku Channel also posted a standout performance, rising 9% overall and benefiting from a 23% jump among viewers ages 25–34. The gains lifted the platform to a record 2.9% share of television.
Meanwhile, cable usage dipped 3% to a 20.5% share, exhibiting its lowest monthly total to date. While NFL games on ESPN remained top performers, the category felt the absence of the MLB playoffs, which caused the cable sports genre to retract by 42%. The category was buoyed slightly by holiday spirit, however, as the cable movie genre saw a 22% increase in viewership.
* Linear streaming is defined as live broadcast and cable content viewed through MVPD/vMVPD services like YouTube TV and cable provider apps. Linear streaming is excluded from the streaming category in The Gauge.
The November 2025 interval spanned five weeks, from 10/27/2025 through 11/30/2025. Nielsen reporting follows the broadcast calendar, with weekly intervals beginning on Monday.
About The Gauge™
The Gauge™ is Nielsen’s monthly snapshot of total broadcast, cable and streaming consumption that occurs through a television screen, providing the industry with a holistic look at what audiences are watching. The Gauge was expanded in April 2024 to include The Media Distributor Gauge, which reflects total viewing by media distributor across these categories. Read more about The Gauge methodology and FAQs.
About Nielsen
Nielsen is a global leader in audience measurement, data and analytics. Through our understanding of people and their behaviors across all channels and platforms, we empower our clients with independent and actionable intelligence so they can connect and engage with their global audiences—now and into the future. Learn more at www.nielsen.com and connect with us on social media (X, LinkedIn, YouTube, Facebook and Instagram).
Press Contact
Lauren Pabst
lauren.pabst@nielsen.com
