Consumers aren’t the only ones who get wrapped up in the spirit of spending around the holidays. At a time when consumers are at their most generous, advertisers are upping their games and spending big to engage with consumers looking for the perfect gift and to share good tidings. Whether through images of cute polar bears sipping soft drinks or wise-cracking chocolate-covered candy, advertisers spent nearly $2.5 billion across the tech, clothing, gaming, book, kitchen, sporting goods and jewelry segments last year, up from $2 billion five years ago.
Getting into the Spirit
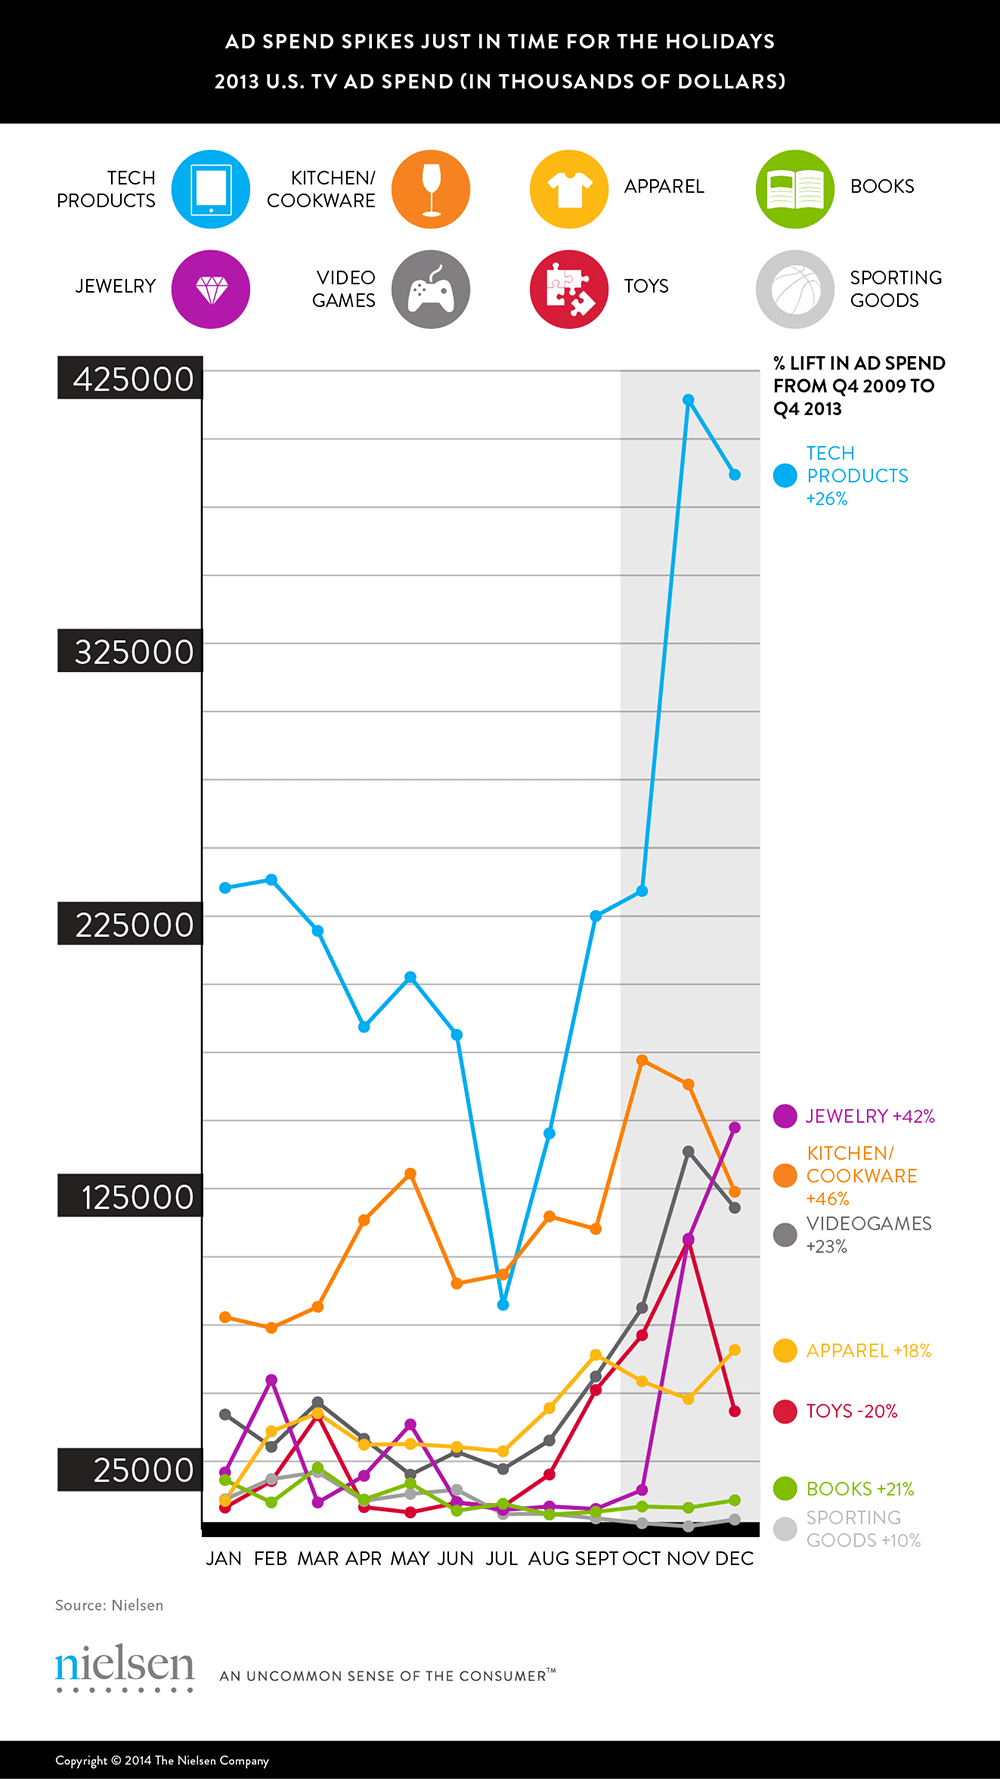
In a recent study, Nielsen looked at traditional gift categories and found notable spikes in ad spending moving into the fourth quarter as consumers begin to brainstorm their holiday shopping lists. Advertisers in every category spent more on advertising during last year’s fourth quarter holiday season than they did five years ago, with tech products (26%), video games (23%), books (21%), kitchen/cookware (46%) and jewelry (42%) leading the charge.
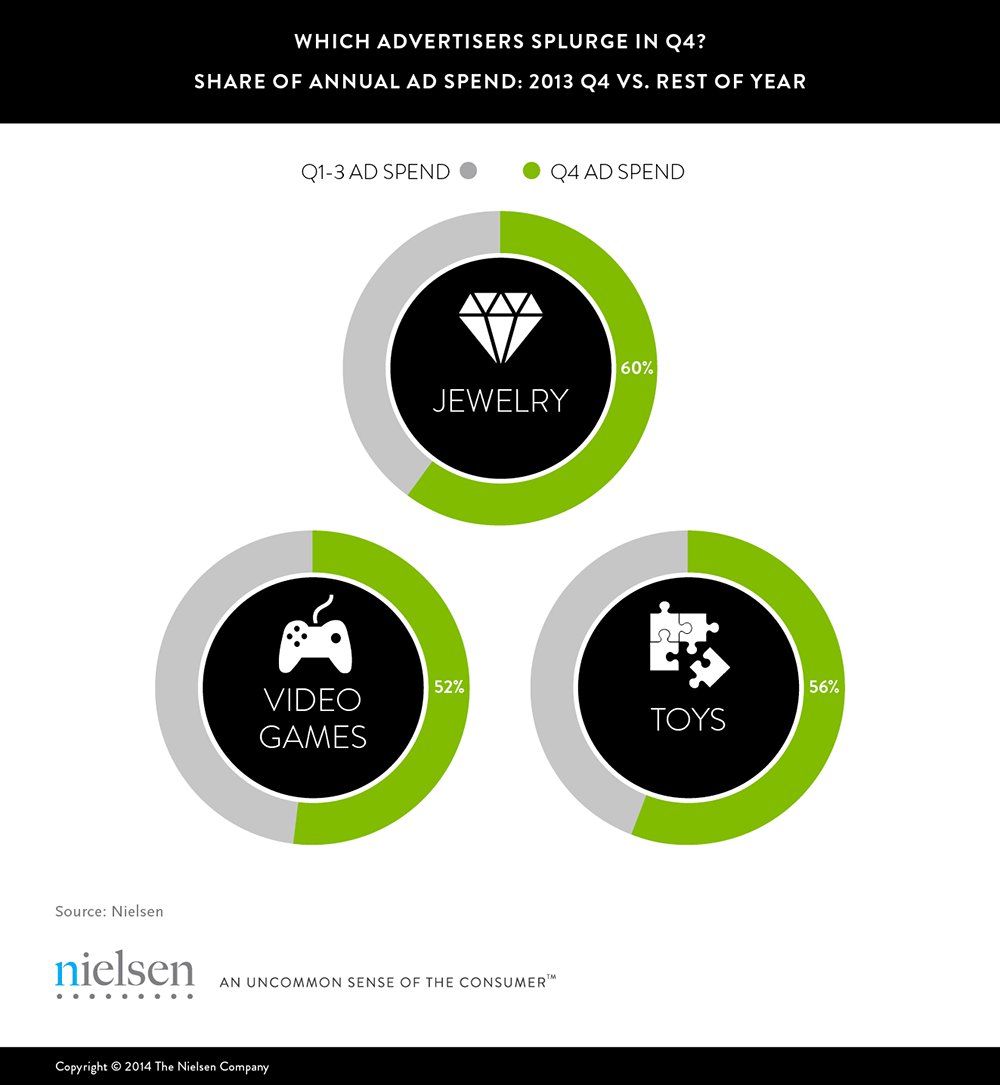
The pre-holiday months remain a crucial time for marketers—capturing the bulk of their ad spending for the year. In 2013, pre-holiday advertising represented a little more than a third of all ad spend for the apparel, cookware and tech categories, but the big players in holiday are jewelry, video games, and—you guessed it—toys. Fourth-quarter ad spend in these areas represented a whopping 60%, 52% and 56% share of 2013 ad spend, respectively.
Last-Minute Ads for Last-Minute Shoppers
Marketers in different retail categories employ different strategies to maximize their ad dollars, however. For example, Nielsen found that ad spending in the jewelry category generally peaks in December. Advertisers may be trying to connect with last-minute male shoppers, 70% of whom said they plan to wait to begin holiday shopping, according to a recent consumer survey of more than 25,000 demographically representative households throughout the U.S. fielded in September 2014.
The consumer survey found that 22% of households have already started shopping this year. Thirty percent of families with five of more family members and 32% of families with kids under age 12 have already started, likely hoping to snag this year’s “It” toy, device or video game before the shelves are bare—and advertisers have clearly taken note of this. Toy advertisers typically focus their holiday spend earlier—in November—with dollar amounts declining significantly in December.
“There’s really no time of the year like this where advertisers can anticipate consumers coming in droves to spend money. It’s key for advertisers to make wise ad investments that differentiate themselves, resonating with audiences and driving consumer sales at home, online and in store,” says Randall Beard, Global Head, Advertiser Solutions, Nielsen. “Being able to anticipate consumer buying behavior is a tremendous leg up, though delivering the best possible holiday campaign is the difference between money in the bank and just another Christmas commercial.”
The Season for Giving (More)
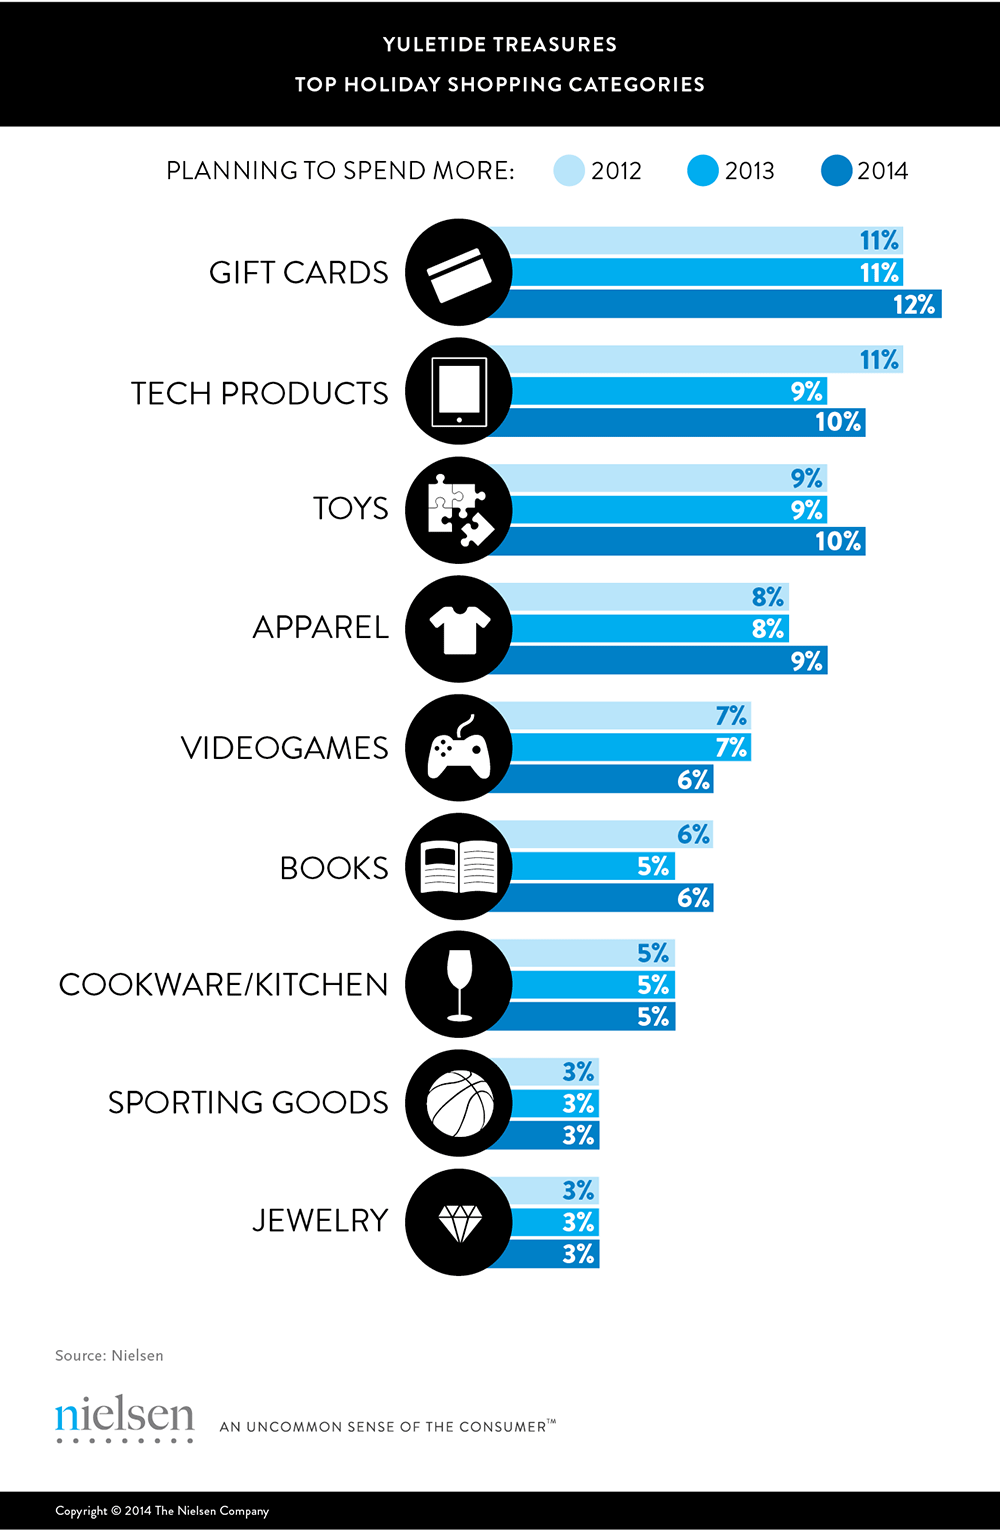
Consumers noted that they plan to spend more this year than in 2013 on many of these same categories, including tech products, toys, apparel and books. And about 32% of homes plan to spend between $250 and $500 overall this holiday season, which contributed to a forecasted dollar sale increase of 1.9% over last year. Multicultural households are also driving increases in spending, with 17% of African-Americans and 13% of both Hispanics and Asian-Americans planning to put a little extra in their loved ones’ stockings this holiday season.
Methodology
For this analysis, Nielsen Monitor-Plus measured television-only advertising expenditure activity on network (English and Spanish-Language), cable (English and Spanish-Language), Syndication and Spot TV for defined specified product categories that fall with the apparel, books, kitchen/cookware, jewelry, toys, video games and tech sectors.
The consumer spending insights in this article were derived from two custom studies: A consumer survey of more than 25,000 demographically representative U.S. households in September 2014 and sales forecasts from an analysis of 92 categories covering five departments representing more than $100 billion in sales.