Last Updated: November 4, 6:33 PM ET
Welcome to Nielsen’s 2020 Election Hub, where you can find the most up-to-date data on the biggest 2020 U.S. presidential election events. Compare presidential debate TV ratings since 1960, discover the shifting power of multicultural voters, see how political ad spending strategy has changed, uncover voter media viewership behavior, and the latest political solutions.
SPOTLIGHT ON:
ELECTION NIGHT TV RATINGS
An estimated 56.9 million people tuned in to watch coverage of the 2020 U.S. presidential election during primetime, from approximately 8:00 p.m. ET to 11:00 p.m. E.T. on Tuesday, Nov. 3, 2020. These television ratings include out-of-home (OOH) viewing as well as connected TV (CTV) viewing. Compared to 2016, nearly 15 million fewer people tuned in to this election.
The prior three presidential elections, election night television ratings have remained relatively stable oscillating between 67 and 71 million viewers. Since the 1960’s the number of households tuning in to election night coverage has increased, but the percentage of total homes has decreased. In 2020, just 31% of households tuned in for the big night, compared to nearly two-thirds in 1960.
More details (regarding age breakouts, channels, etc.) from recent election events are available in the media advisories below. Stay tuned for Election Night TV ratings.
POLITICAL media advisories
Below are the most recent media advisories featuring tv ratings, household viewership, and total audience viewership estimates, age breakouts and other details for the Democratic and Republican National Convention, and Presidental and Vice Presidential debates.
VOTER DEMOGRAPHICS & Viewership PREFERENCES
The presidential election puts a spotlight on the issues that are top of mind for many Americans and increasingly those of multicultural consumers. These charts highlight America’s unique voter demographics and viewership preferences from our database.
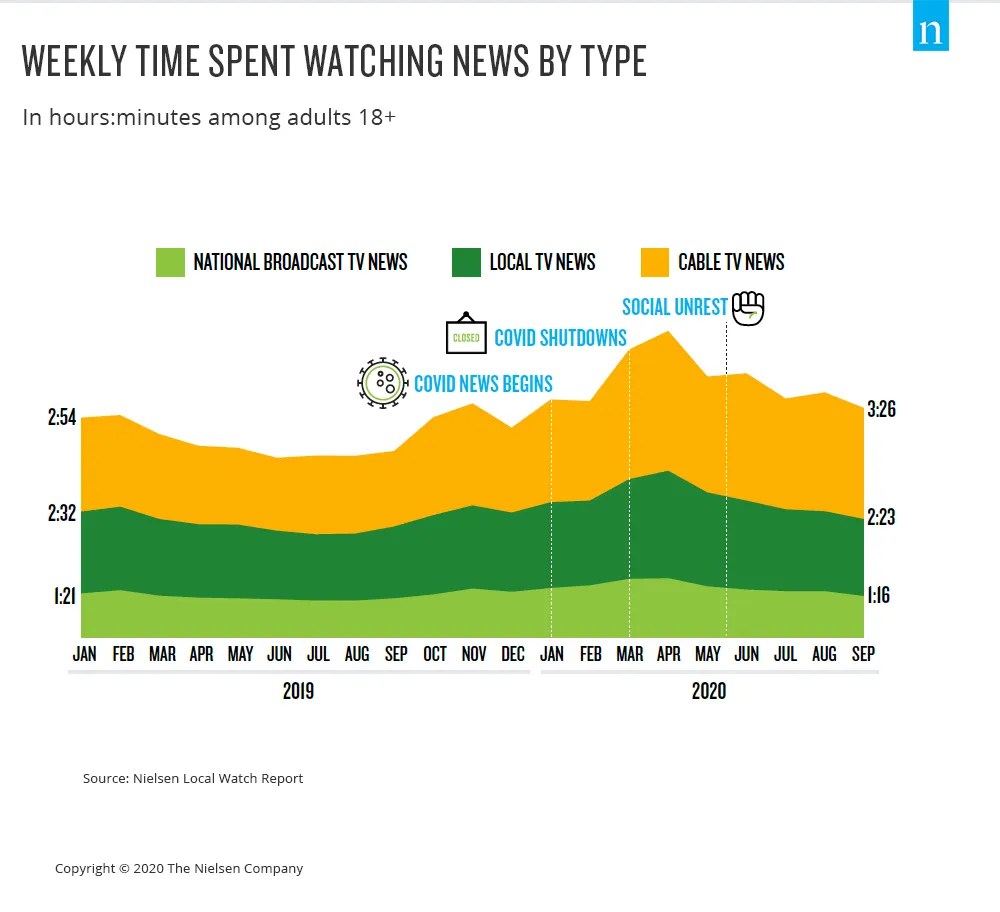
PANDEMIC AND SOCIAL UNREST DRIVE DEMAND FOR NEWS
COVID-19 events and social unrest have kept demand for news consumption, even during warmer months, signaling the importance these events have had on the daily lives of Americans. For politicians, local and national, these events have become the centerpiece of many platforms and political campaigns.
News engagement hit new heights in Q2 2020, with especially impressive gains in March and April before gradually returning to pre-COVID levels. This is true not just for local TV news, national broadcast TV news and Cable TV news, but also across digital platforms. Across gender and ethnicity, the average daily reach for current events and global news on desktops/laptops, smartphones and tablets is up 40 – 60% between April 2019 and 2020. Meaning, people visiting Current Events sites/apps are engaged more often and for longer periods of time.
NEWS AUDIENCES ARE BECOMING MORE DIVERSE
The events of 2020 have created a catalyst for a dramatic shift in TV news viewership demographics. Demand for local and national news has increased across the board with Asian, Hispanic and Black American viewers driving most of the growth. Between Q2 2020 and Q2 2019, Asian American viewers nearly doubled (+86%) their consumption of news per week from over three hours per week to just over six. Black viewers surpassed an average of 10 hours per week, up from six hours and 43 minutes, an increase of 58%. Viewership also varied significantly across local markets, where factors such as demographics, the Black Lives Matter movement, and the impact of the pandemic come into play. In the second quarter of 2020, Black Americans spent 12 and half hours watching TV news per week in Detroit, Philadelphia and Chicago. In most markets local TV news dominated, followed by cable TV.
People ages 55 and older continued to tune in to TV news at an astonishing rate of 14 hours and 43 minutes per week, but growth came largely from the 18 – 34 demographic. These younger consumers watched an average of just over two hours of TV news each week in the second quarter of 2020, a 134% increase from the previous year.
PRESIDENTIAL CAMPAIGN AD IMPRESSIONS
Nielsen Ad Intel data shows a significant uptick in TV and radio advertising impressions purchased by measured presidential campaigns and identifiable political organizations in the third quarter of 2020. In total, political campaigns measured purchased 17.6 million English language ad impressions in the third quarter, which is five times more impressions than the first two quarters of 2020. This investment is twice as high as the peak English ad impression investment during the 2016 presidential election, which saw a high of 9.2 million.
At the same time, Spanish language ad impressions were nearly triple the size compared to the first quarter of 2020. This data shows a deviation from previous years where organizations invested more in Spanish language ads during earlier quarters and then decreased investment in the third quarter.
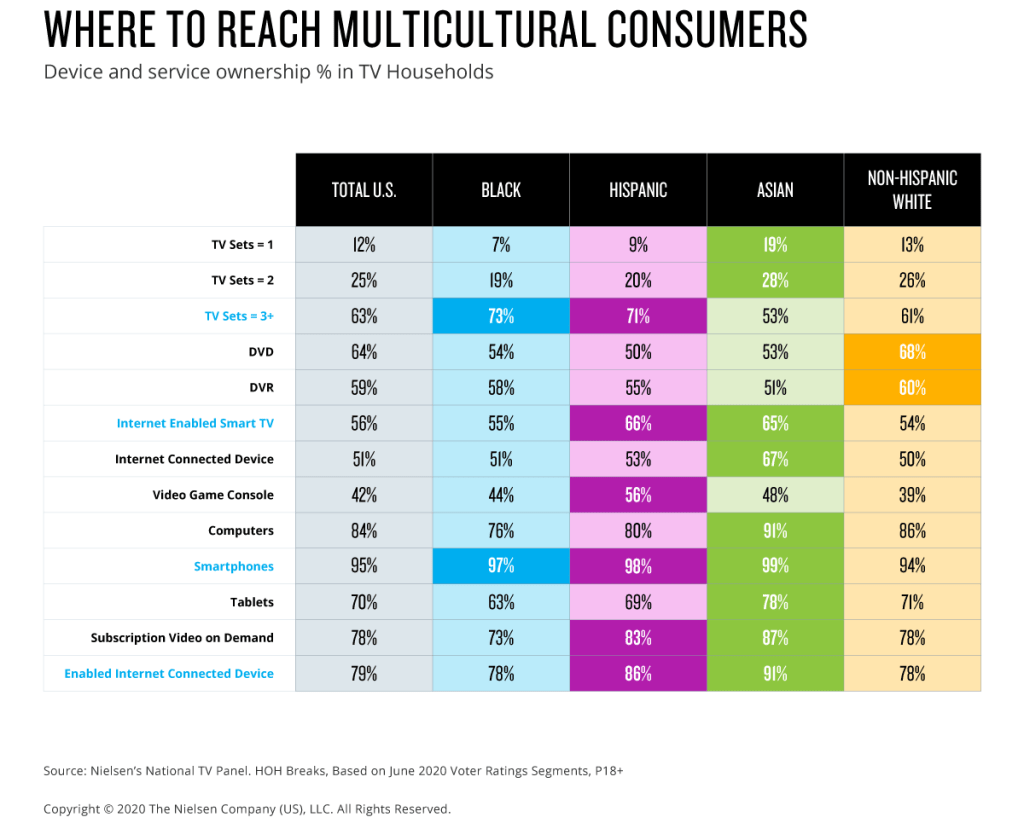
Device ownership by registered voter
Media measurement continues to show that media habits vary across multicultural viewers, which means that reaching multicultural Americans requires a varied omnichannel approach. Black and Hispanic Americans are heavy consumers of television and own more TVs, while Asian Americans tend to over-index on device ownership of other, smaller screens such as tablets, computers and smartphones.
For many of these voters, politics has bled into every part of their lives from the shows they watch to the podcasts they listen to. Nielsen’s voter ratings look at the voters amongst the tv viewers and found that Fox audiences aren’t all Republican, niche cable programming offers an opportunity to reach key voter audiences, while sports seems to unite fans and voters alike.
Registered voters by demographic
Voter demographics are shifting in America. Male, female and White voting-age populations have all remained relatively stable since the last presidential election while other multicultural groups have seen significant population shifts, particularly Asian Americans and those who identify as two or more races. Altogether, multicultural registered voters make up almost a third (29%) of all voters.
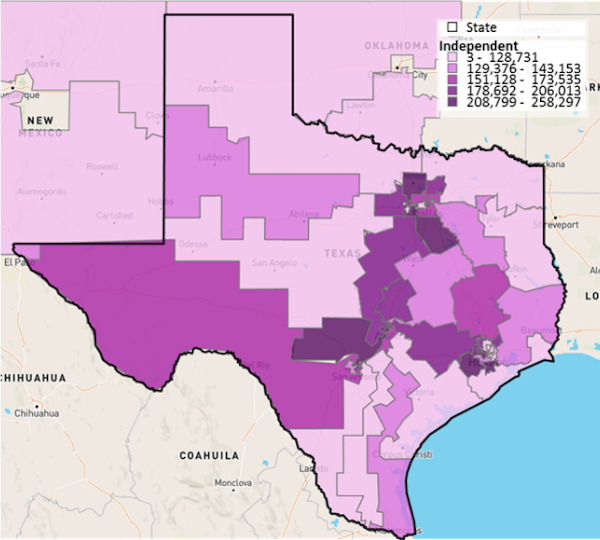
Political affiliations by demographic
Unlike White Americans, whose party lines are more evenly distributed, registered multicultural voters, particularly those who L2, a voter mapping and demographic company, defines as likely African-American or Hispanic and Portuguese, are significantly more likely to identify as Democrats. This uneven distribution of political affiliations, plus large populations of Latinos residing in swing states, makes this community’s voting power significant. Like African Americans, many Hispanics have been on the front lines of the battle against the novel coronavirus this year in essential occupations, making them even more focused on the economy and health care access.
Voter frequency by demographic
When it comes to voting only a small percentage of registered voters regularly cast their votes during the general and primary elections. In fact, over half of Americans, regardless of their ethnicity, are occasional voters and have voted just 1 – 4 times in the past four general and primary elections.
Nearly a third of white Americans are heavy voters, voting five to eight times over the last four general and primary elections. Black Americans have the next highest heavy voter population, with 25%. Yet a deeper dive shows that among Black Americans, there are significant inequalities in voting behavior across gender. According to the U.S. Census Black women consistently lead in turnout rates. In 2016, 64% of Black women cast ballots compared to just 54% of men.
HISTORICAL ELECTION EVENT RATINGS
We’ve had our pulse on America’s political main events since the 1960s, and now you can see how Americans have viewed each one over the last six decades. The charts below showcase our available historical ratings for key election events.
Multicultural viewership of the 2016 presidential debates
In 2016, an estimated 84 million viewers ages 2+ tuned in to the first presidential debate with Hillary Clinton and Donald Trump. Despite strong television ratings across the presidential debates, a deeper dive into the viewership data shows that primarily white non-Hispanic voters were tuning in. In fact, just 5% of voters who identify as Asian tuned in to the first and second debates, which dropped down to 4% by the third debate.
Outreach to multicultural groups is a major opportunity for politicians running in 2020, yet research shows it’s still lagging. According to a recent survey by the Asian and Pacific Islander American Vote organization, Asian voters reported they were not contacted by either major party.
Presidential and VP Debates
This year’s 2020 presidential and vice presidential televised debates were marked by two significant firsts. The Commission on Presidential Debates canceled the second debate, making it the first time since 1996 that only two presidential debates were held. Another unprecedented event was when Kamala Harris graced the Vice Presidential debate stage as the first African American woman to do so.
Overall, television viewing of the 2020 election debate series was strong. During the first debate an estimated 73.1 million people tuned in across broadcast and cable networks, PBS member stations, connected TVs and in out-of-home locations. This debate drew 11 million fewer viewers than the first presidential debate in 2016, but over 10 million more than the presidential debates in 2012. Despite this ebb and flow in viewership, ratings for presidential debates have been steadily increasing since 2000, when they dropped to 25.9%. Together, Kamala Harris and Vice President Mike Pence drew 57.9 million viewers, the highest viewership numbers since 2008 when Joe Biden and Sarah Palin debated. This year’s VP debates drew over 20 million more viewers than Tim Kaine and Mike Pence’s 2016 debate.
For the first time ever, we’ve compiled historical TV ratings, total households and audience viewership numbers for presidential and vice presidential debates in the interactive charts below, enabling you to spot trends and trend-breaking events.
PRESIDENTIAL DEBATE RATING CHART NOTES
*Oct. 16, 1996, does not include FOX, because of a MLB Playoff Game.
**Oct. 11, 1992, does not include CBS, because of a MLB Playoff Game.
***Some NBC and FOX affiliates aired the presidential debate on a tape-delay due to MLB Playoff games.
****Fox is not included in this total, due to a MLB Playoff Game.
*AZA on Tape Delay.
^Monday Night Football Game on Sept. 26, Sunday Night Football, NLDS and ALDS games on Oct. 9, NLCS and ALCS games on Oct. 19.
Note: There were no televised presidential debates for the years 1972, 1968 and 1964.
NOTES FOR 2020 Debates
Out-of-home viewing as well as connected TV (CTV) viewing are included in the 2020 total figures for this advisory. Contribution coming from CTVs can be as much as 11% for televised political events.
Data above is inclusive of broadcast and cable networks, as well as PBS member stations. Debate 1 coverage of ad-supported networks only was 71.5 million viewers among persons 2+.
Debate 2 – Canceled
Debate 3 coverage of ad-supported networks only was 61.7 million viewers among persons 2+
Democratic and Republican National Convention Ratings
TV audience ratings during the 2020 Democratic and Republican National Conventions were lower compared to the last three presidential election years. For both conventions, the highest-rated event was day four, when 24.6 and 23.8 million Americans ages 2+ tuned in to the DNC and RNC, respectively. In 2016, 29.8 and 32.2 million Americans tuned in to day four of the DNC and RNC.
Looking back, the 1992 average ratings for DNC and RNC, with George H. W. Bush, Bill Clinton and Ross Perot, were some of the highest in recent history, attracting over 20 million homes. In 2008, when Barack Obama and John McKain accepted their nominations day four of the DNC and RNC, 27.7 and 28.2 households tuned in (approximately 38 and 39 million viewers ages 2+).
CONVENTION RATING Chart and HISTORICAL TABLE NOTES
1976 and 1980 data based on primetime coverage only (7:30 p.m.-11p.m.).
1996 data based on closest comparable time period on all five networks: Mon-Thu appr. 10-11:15 p.m.
*The Family Channel also aired the ’96 Republican Convention but is not included in the Total Rating and Total Homes.
** 2000 data based on the sum of Rep. Convention Coverage during Common Coverage Time Periods: ABC, CNN, MSNBC, FOXNC=Mon-Thu appr. 10-11 p.m.; CBS=Wed-Thu appr. 10-11 p.m.; NBC=Tue-Thu appr. 10-11 p.m.
***2000 data based on the sum of Dem. Convention Coverage during Common Coverage Time periods: ABC, CNN, MSNBC, FOXNC = Mon appr. 10-11:45 p.m., and Tues through Thurs. appr. 10-11 p.m.; NBC= Mon 10:30-11:45 p.m., Wed-Thu 10-11 p.m.; CBS=Wed-Thu appr. 10-11 p.m.
+2004 data based on the sum of Dem. Convention Coverage during Common Coverage Time Periods: ABC, CBS, NBC, CNN, MSNBC, FOXNC = Mon, Wed, Thur. 10-11 p.m.; CNN, MSNBC, FOXNC = Tues appr. 10-11p.m.
++2004 data based on the sum of Rep. Convention Coverage during Common Coverage Time Periods: CNN, FOXNC, MSNBC= Monday 10-11 p.m.; ABC, CBS, NBC, CNN, FOXNC, MSNBC* = Tuesday and Wednesday: 10-11 p.m.; ABC, CBS, NBC, CNN, FOXNC, MSNBC* = Thursday: 10-11:15 p.m. (*coverage includes sustained programs.)
+++ BET and TVONE = Democratic Convention only, UNI/TEL Thursday Only for Both Conventions. All other coverage times are Monday-Thursday 10-11 p.m. (No Rebulican Coverage on Monday September 1 due to hurricane coverage.)
2008 RNC Day 1: No common coverage due to Hurricane Gustav. No persons 35 – 54 data.
RNC Day 2 and 3 – ABC, CBS, NBC, CNN, FOX News, MSNBC
RNC Day 4 – ABC, CBS, NBC, CNN, FOX News, MSNBC, Univision, Telemundo
DNC Days 1, 2, 3 – ABC, CBS, NBC, CNN, FOX News, MSNBC, BET, TV One
DNC Day 4 – ABC, CBS, NBC, CNN, FOX News, MSNBC, BET, TV One, Univision, Telemundo
2012 RNC Day 1: No common coverage due to Hurricane Isaac. Events postponed.
RNC Day 2 and 3 – ABC, CBS, CNBC, CNN, FOXNC, CRNT, MSNBC, NBC and PBS
RNC Day 4 – ABC, CBS, CNBC, CNN, FOXNC, CRNT, MSNBC, MUN2, NBC, PBS and UNI
DNC Day 1 and 2 – ABC, CBS, NBC, BET, CNN, CRNTV, FOXNC, MSNBC, and PBS
DNC Day 3 – ABC, CBS, NBC, BET, CNN, CNBC, CRNTV, FOXNC, MSNBC, MUN2, PBS, TV One and UNI
2016 Data ratings are inclusive of broadcast program ratings based on start time and end time of each telecast. Cable ratings are based on common time starting at 10 p.m. and end time based on most common end time rounded to the nearest quarter hour; Total Ratings is duration weighted.
2016 data based on the duration weighted sum of Republican National Convention Coverage Times:
Day 1 and Day 2 – ABC, CBS, NBC (program rating) and CNN, Fox Bus News, Fox News Channel, MSNBC (10-11 p.m.)
Day 2 – ABC, CBS, NBC (program rating) and CNN, Fox Bus News, Fox News Channel, MSNBC (10-11:15 p.m.)
Day 3 – ABC, CBS, NBC (program rating) and CNN, CNBC, Fox Bus News, Fox News Channel, MSNBC (10-11:45 p.m.)
Day 4 – ABC, CBS, NBC, Uni (program rating) and CNN, CNBC, Fox Bus News, Fox News Channel, MSNBC, NBC Universo (10-11:45 p.m.)
Note: Due to a change which now reports PBS as a syndicated network, 2016 convention data only reflects commercially-supported networks and does not include PBS estimates.
Republican National Convention day-by-day networks for household breakout
Day 1 and 2 – ABC, CBS, NBC, CNN, Fox Business Network, FOXNC, and MSNBC
Day 3 – ABC, CBS, NBC, CNN, CNBC, Fox Business Network, FOXNC, and MSNBC
Day 4 – ABC, CBS, NBC, UNI, CNN, CNBC, Fox Business Network, FOXNC, MSNBC, and NBC Universo
Democratic National Convention day-by-day networks for household breakout
Day 1 and 2 – ABC, CBS, NBC, CNN, Fox Business Network, FOXNC, and MSNBC
Day 3 – ABC, CBS, NBC, CNN, CNBC, Fox Business Network, FOXNC, and MSNBC
Day 4 – ABC, CBS, NBC, UNI, CNN, CNBC, Fox Business Network, FOXNC, MSNBC, and NBC Universo
2020
Source: Nielsen, Fast National Ratings.
NOTE: Data above is inclusive of broadcast and cable networks, as well as PBS member stations.
Day 1 DNC: Common coverage of ad-supported networks only was 18.8 million viewers among persons 2+
Day 2 DNC: Common coverage of ad-supported networks only was 18.3 million viewers among persons 2+
Day 3 DNC: Common coverage of ad-supported networks only was 21.6 million viewers among persons 2+
Day 4 DNC: Common coverage of ad-supported networks only was 23.5 million viewers among persons 2+
Day 1 RNC: Common coverage of ad-supported networks only was 16.3 million viewers among persons 2+.
Day 2 RNC: Common coverage of ad-supported networks only was 18.7 million viewers among persons 2+.
Day 3 RNC: Common coverage of ad-supported networks only was 16.7 million viewers among persons 2+.
Day 4 RNC: Common coverage of ad-supported networks only was 23.1 million viewers among persons 2+.
Democratic National Convention networks for day-by-day household breakout
Day 1, 2 and 3 – ABC, CBS, NBC, PBS, CNN, CNNe, Fox Business, FOXNC, MSNBC and Newsy
Day 4 – ABC, CBS, NBC, TEL, Univision, PBS, CNN, CNNe, Fox Business, FOXNC, MSNBC and Newsy
Republican National Convention networks for day-by-day household breakout
Day 1, 2 and 3 – ABC, CBS, NBC, PBS, CNN, CNNe, Fox Business Network, FOXNC, MSNBC, Newsmax and Newsy.
Day 4 – ABC, CBS, NBC, Telemundo, Univision, PBS, CNN, CNNe, Fox Business Network, FOXNC, MSNBC, Newsmax and Newsy.
RELATED INSIGHTS
Although presidential elections are the main event, there’s much more to politics. Read through our past articles to see how Americans have tuned in or out of politics in the past.

SOLUTIONS FOR THE POLITICALLY SAVVY
With so much at stake, it’s critical that campaigns allocate the right resources in order to reach key voters and maximize investments. Discover how to reach voters, develop impactful messaging and increase the overall awareness of their candidates.
PARTY AFFILIATION BY CONGRESSIONAL DISTRICT
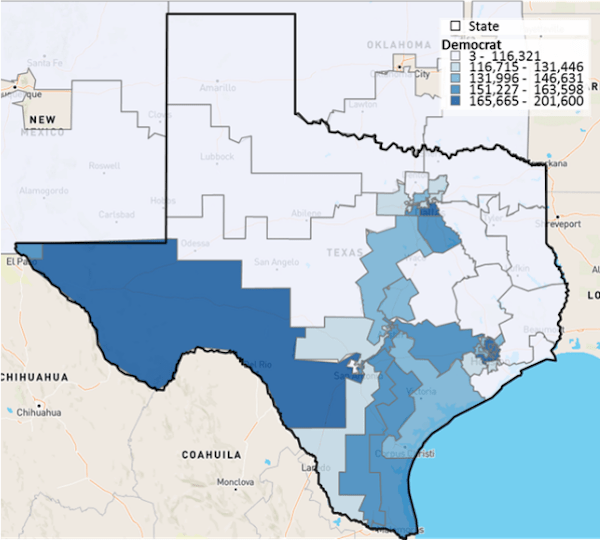
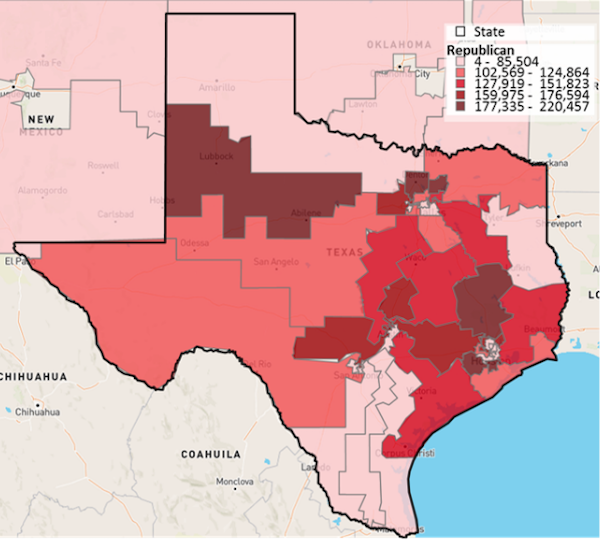
Source: Nielsen Scarborough/Rhiza 2017