Editor’s note: This iteration of The Gauge includes a methodology change that more accurately differentiates Hulu Live and Hulu SVOD viewing. This change does not reflect a change in consumption. Rather, it reflects how viewing is being credited. The net impact is roughly half a share point, which affects both Hulu SVOD and total streaming.
Total television usage inched up 2% in October, bolstered by a 9.4% increase in broadcast viewing. While the seasonal uptick in October isn’t unique, this year’s gains were achieved without the benefit of a robust new programming schedule. Without any new scripted programming, the broadcast boost was almost entirely attributable to sports programming.
The robust NFL schedule and the MLB’s World Series were the primary drivers of the 15% rise in sports viewing across broadcast channels, powering October to its third consecutive month of broadcast gains. It was also the largest gain for broadcast since January 2023. The increase in sports viewing also attracted an influx of younger viewers: broadcast viewing among 18-24-year-olds was up 15%. On a year-over-year basis, however, total broadcast viewing was down 5.6% and the sports genre was down by 8%.
Cable benefited from double-digit gains across the news and sports genres (17% and 19%), with news taking the top-genre crown capturing 21.8% of cable viewing. While these gains resulted in 0.9% more viewing, it wasn’t enough to keep pace with the total TV trend, causing a loss of 0.3 share points for the month to land at 29.5%, the smallest share for the cable category to date.
Trending the opposite of broadcast, streaming gave back share for a third consecutive month, although usage was almost flat with September (-0.6%). Without the methodology change noted above, however, the share loss would have only been 0.4 instead of 0.9. While usage was largely stable across platforms, October featured a couple of unique data nuggets:
Suits remained the top program, but viewership was down a third from September.
- Suits remained the top program, but viewership was down a third from September. Netflix, which offers Suits along with Peacock, retained eight of the top 10 streaming titles in October.
- Disney+ viewing was up 1.5%, and held the other two top streaming titles: Bluey and Elemental.
- Amazon Prime Video usage was up 1% and continues to peak on Thursdays due to NFL games.
Without the typical rush of new scripted content this fall, it’s likely that we’ll continue to see atypical TV usage trends until mid-to-late first quarter 2024. At that point, it will be interesting to see if usage spikes, which would be a trend break from what we’re accustomed to seeing at that time of year.
October data trends with Brian Fuhrer
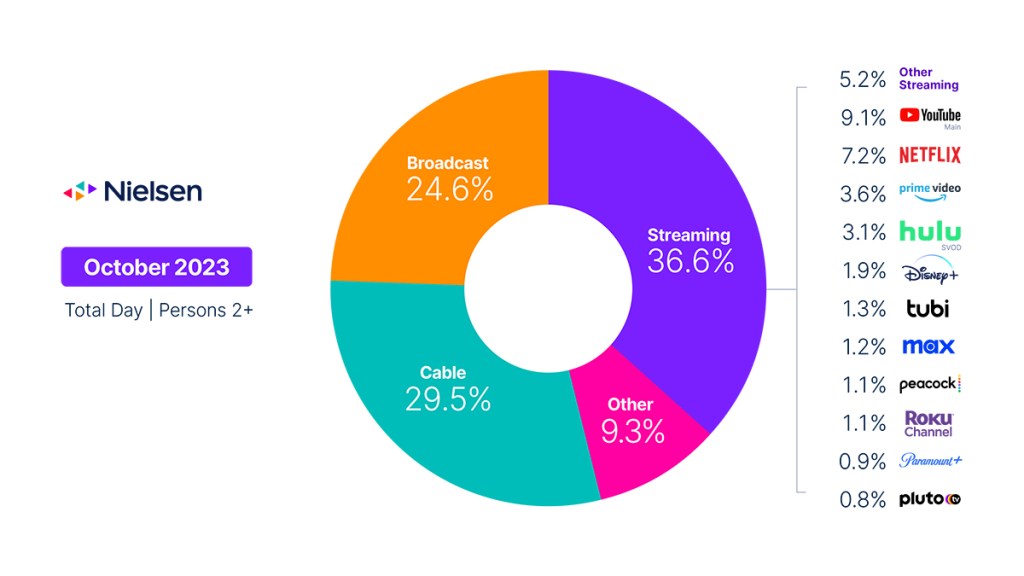
The Gauge provides a monthly macroanalysis of audience viewing behaviors across key television delivery platforms, including broadcast, streaming, cable and other sources. It also includes a breakdown of the major, individual streaming distributors. The chart itself represents monthly total television usage, broken out into share of viewing by category and by individual streaming distributors.
Methodology and frequently asked questions
How is ‘The Gauge’ created?
The data for The Gauge is derived from two separately weighted panels and combined to create the graphic. Nielsen’s streaming data is derived from a subset of Streaming Meter-enabled TV households within the National TV panel. The linear TV sources (broadcast and cable), as well as total usage are based on viewing from Nielsen’s overall TV panel.
All the data is time period based for each viewing source. The data, representing a broadcast month, is based on Live+7 viewing for the reporting interval (Note: Live+7 includes live television viewing plus viewing up to seven days later for linear content).
What is included in “other”?
Within The Gauge, “other” includes all other TV usage that does not fall into the broadcast, cable or streaming categories. This primarily includes all other tuning (unmeasured sources), unmeasured video on demand (VOD), audio streaming, gaming and other device (DVD playback) use.
Beginning with the May 2023 interval, Nielsen began utilizing Streaming Content Ratings to identify original content distributed by platforms reported in that service to reclassify content viewed via cable set top boxes. This viewing will credit to streaming and to the streaming platform which distributed it. It will also be removed from the other category, where it was previously reflected. Content not identified as original within Streaming Content Ratings and viewed through a cable set top box will still be included in other.
What is included in “other streaming”?
Streaming platforms listed as “other streaming” includes any high-bandwidth video streaming on television that is not individually broken out. Apps designed to deliver live broadcast and cable (linear) programming (VMVPD or MVPD applications like Sling TV or Charter/Spectrum) are excluded from “other streaming.”
Where does linear streaming contribute?
Linear streaming (as defined by the aggregation of viewing to vMVPD/MVPD apps) is excluded from the streaming category as the broadcast and cable content viewed through these apps credits to its respective category. This methodological change was implemented with the February 2023 interval.
What about live streaming on Hulu and YouTube?
Linear streaming via vMVPD apps (e.g., Hulu Live, YouTube TV) are excluded from the streaming category. ‘Hulu SVOD’ and ‘YouTube Main’ within the streaming category refer to the platforms’ usage without the inclusion of linear streaming.