A short list of creators delivered the cartoons America watched most this TV season. Their work spans three decades, and their fans span every generation.
Bikini Bottom. Springfield. Quahog. The Tri-State Area. Bedrock. Odds are one of those places takes you right back to your favorite moments after school or Saturday mornings. This International Animation Day, we looked at the creators behind the most-watched animated shows of the 2025-26 TV season and found a short list of names doing a lot of the drawing. And streaming is doing a lot of the watching: 58% of the minutes for the 15 most-watched animated series came from streaming.
The big three
If your couch time leans toward Quahog, you’re in good company. Seth MacFarlane’s shows lead with 92.7 billion minutes when we combine viewing for his breakout show Family Guy with American Dad and The Cleveland Show. For those who like to keep up with their friends under the sea, Bikini Bottom is another hot spot to hang out. Stephen Hillenburg’s SpongeBob SquarePants and its spinoffs have soaked up 73.0 billion minutes. Following closely behind is a new-but-lovable Brisbane backyard: Joe Brumm’s Bluey, minisodes and compilations included, rounds out the top three with 71.5 billion minutes watched.
Together, these three creative teams logged 237.2 billion minutes over the 2025-26 TV season, more than the next five creators on the list combined (202.1 billion). Among the 15 most-watched animated series, 44% of all minutes came from their shows.
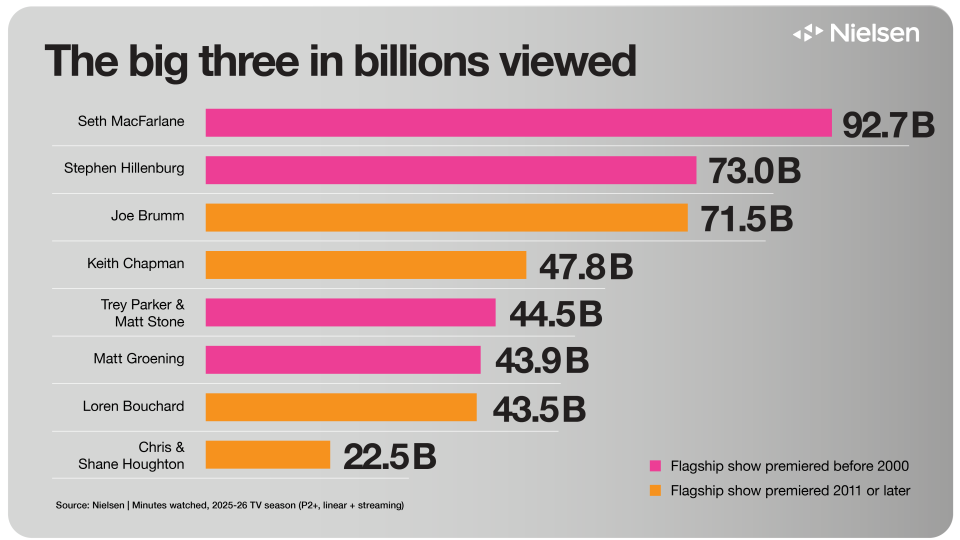
Top creators by total minutes watched (billions). Shows: MacFarlane (Family Guy, American Dad, The Cleveland Show); Hillenburg (SpongeBob SquarePants, The Patrick Star Show, Kamp Koral); Brumm (Bluey); Chapman (PAW Patrol, Rubble & Crew); Parker & Stone (South Park); Groening (The Simpsons, Futurama, Disenchantment); Bouchard (Bob’s Burgers, Home Movies, Central Park); Houghton (Big City Greens). The creators receive full credit for every show they created or co-created.
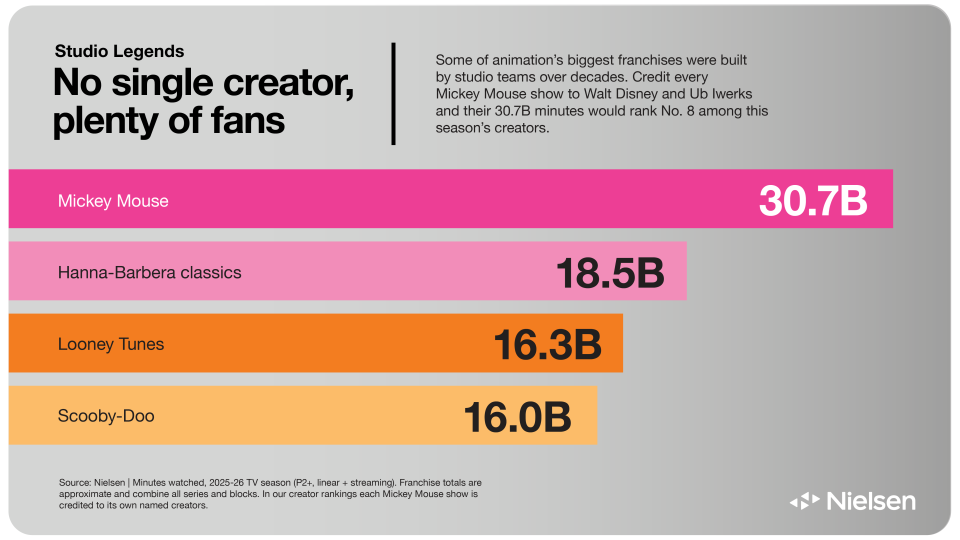
Franchise totals, minutes watched (billions). Mickey Mouse: every Mickey, Minnie and friends show, credited here to Walt Disney & Ub Iwerks. Hanna-Barbera classics: The Flintstones, The Jetsons, Yogi Bear, Tom and Jerry, and more. Looney Tunes: all series, specials and blocks. Scooby-Doo: all series and specials. Totals are approximate. In the creator rankings, each Mickey Mouse show is credited to its own named creators.
Every era has its hit maker
If you look at the rankings by premiere date, they turn into a timeline of TV animation. The classic class (Matt Groening, Trey Parker and Matt Stone, Stephen Hillenburg, and Seth MacFarlane) launched their flagship shows between 1989 and 1999. Those creators account for 254 billion minutes, the equivalent of over 483,000 years of nonstop viewing.
The newer class is building fast. Loren Bouchard (Bob’s Burgers, 2011), Keith Chapman (PAW Patrol, 2013), Joe Brumm (Bluey, 2018) and Chris and Shane Houghton (Big City Greens, 2018) already add up to 185 billion minutes. Big City Greens delivers 22.5 billion minutes while Bob’s Burgers orders up 43.0 billion. The classic class has an advantage of episodes and reruns, but Bluey, with a fraction of The Simpsons’ library, drew more than twice its minutes (68.0 billion vs. 28.0 billion) and is a cross-generational hit.
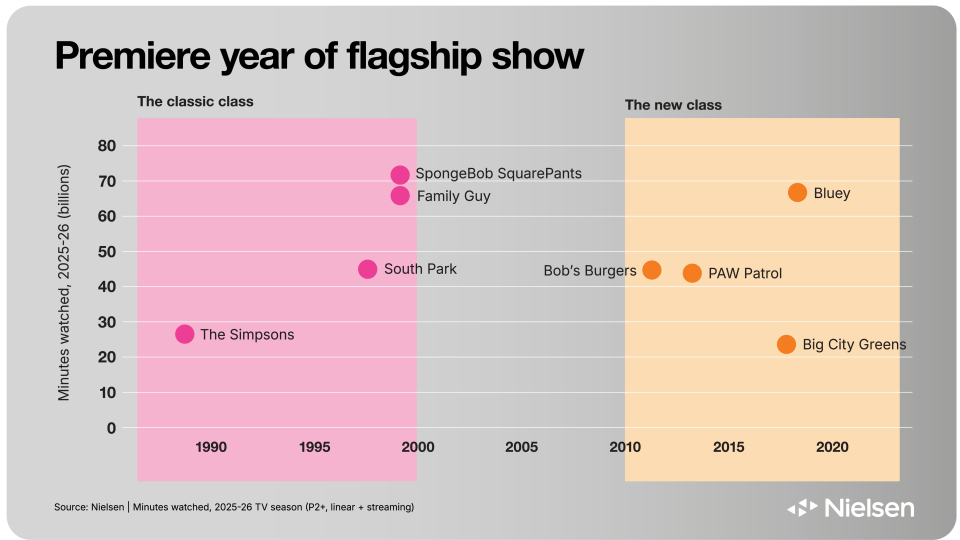
When each hit maker’s flagship show premiered, and how much it’s watched today. X axis: premiere year of each creator’s flagship show. Y axis: 2025-26 total minutes watched for a creator’s flagship show.
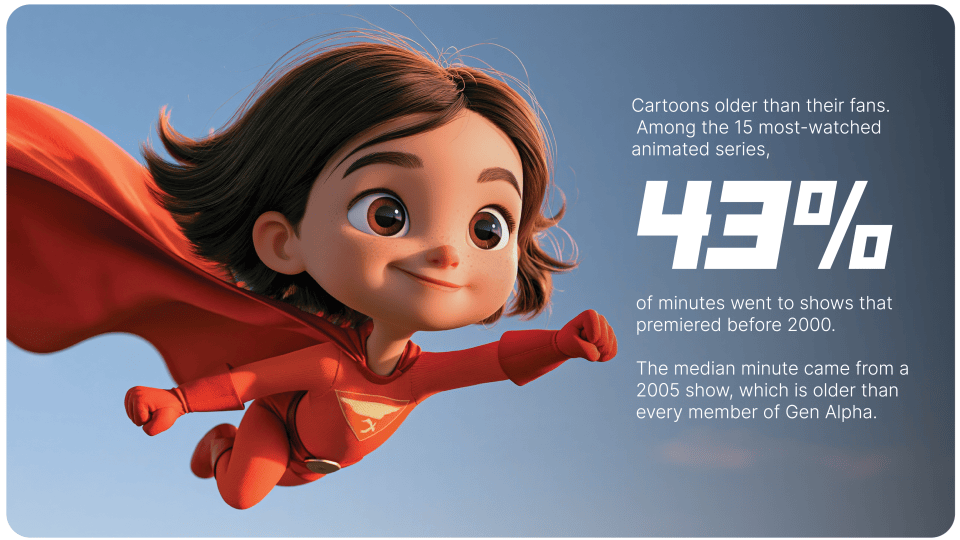
A cartoon for every generation
These creators built worlds that work for the whole household, and the 15 most-watched series prove it. Kids 2-17 account for 29% of their minutes, viewers 18-34 for 28%, viewers 35-49 for 23% and viewers 50+ for 20%. No generation has the remote to itself.
What changes is where each generation watches. On linear TV (broadcast and cable), viewers 50+ drive 36% of the top 15’s minutes. On streaming, they drive just 9%, while kids (34%) and viewers 18-34 (35%) take over. The same cartoons are reaching different crowds based on where they prefer to watch.
Peppa Pig leans youngest, with kids making up 59% of its minutes, though adults still account for the other 41%. Bluey splits almost exactly in half, at 51% kids and 49% adults, including 14% from viewers 50+, a sign that parents and grandparents are on the couch too. It appears that everyone wants both a valuable life lesson and an ice cream.
At the other end of the chart, South Park is the oldest-skewing show in the top 15, with kids at just 5% of its minutes. And The Simpsons is the most evenly balanced, with every age group between 17% and 34%.
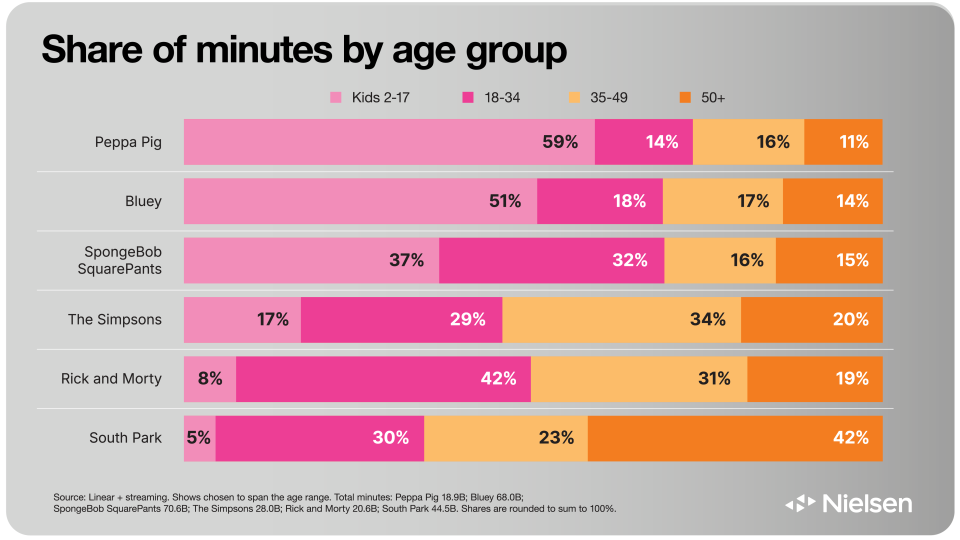
Share of minutes by age group. Linear + streaming. Shows chosen to span the age range. Total minutes: Peppa Pig 18.9B; Bluey 68.0B; SpongeBob SquarePants 70.6B; The Simpsons 28.0B; Rick and Morty 20.6B; South Park 44.5B. Shares are rounded to sum to 100%.
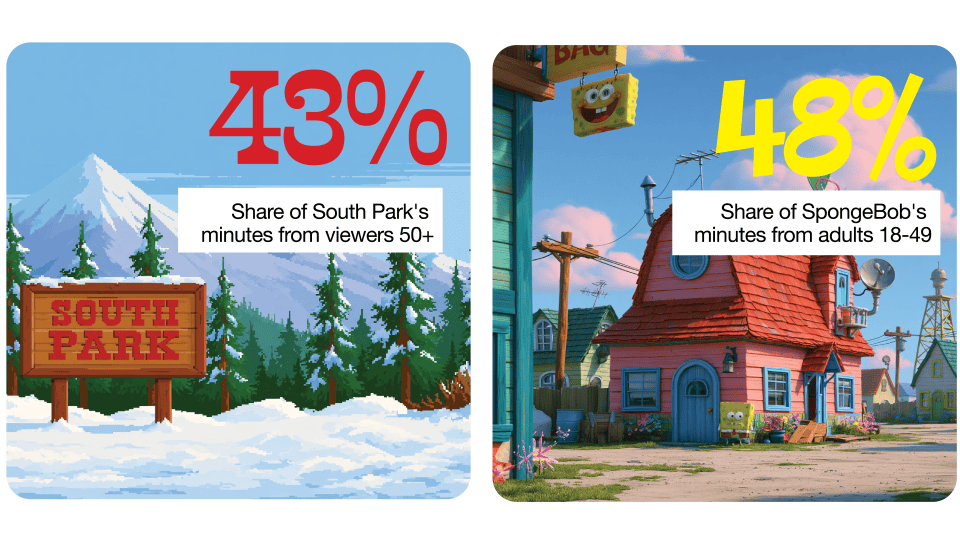
Age patterns also show up in surprising places (respect your elders). South Park, which launched as late-night cable comedy, now draws 42.3% of its minutes from viewers 50+—the highest share among the 15 most-watched series. SpongeBob, famously launched as a kids’ show in 1999, gets 47.9% of its minutes from adults 18-49 today. The classics have loyal audiences, but streaming changes the picture. The Simpsons draws 48% of its linear minutes from viewers 50+ and just 9% of its streaming minutes. And whether it is the Stone Age or the Space Age, The Flintstones and The Jetsons each get 75% of their Boomerang minutes from viewers 50+.
From sidekick to star
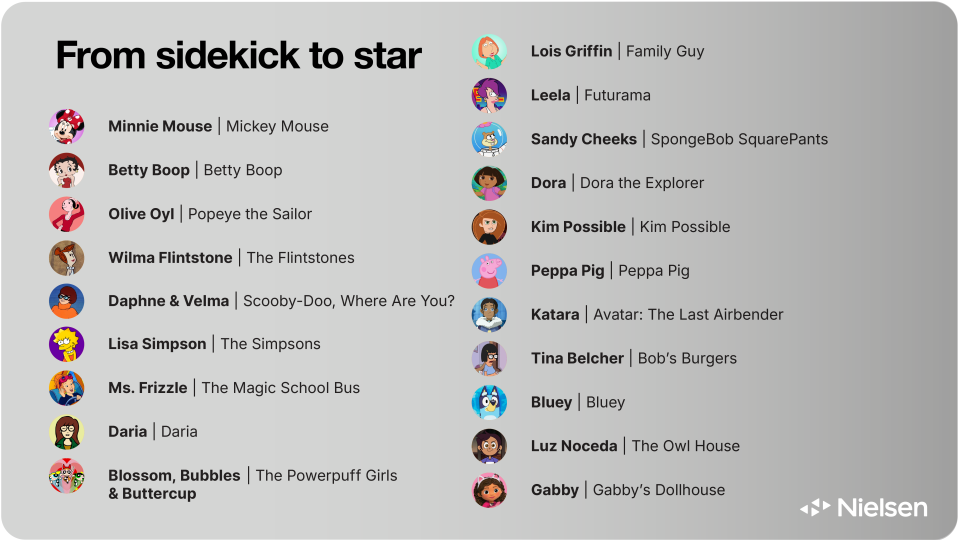
Women have been part of animation from the start. Minnie Mouse, Olive Oyl and Wilma Flintstone were beloved but, like many of their contemporaries, shared the limelight with a male star who took center stage.
Then came a wave of new characters, showing up more often and stepping into the starring role. Daria, the Powerpuff Girls, Kim Possible, Peppa Pig, and Bluey aren’t sidekicks or love interests—they’re titular characters.
Animation is for everyone, and it’s a great medium for telling the many different stories of the people who watch it. As more new characters arrive and more of them take the lead, the stories on screen look more like the audience on the couch. Ideally, that trend continues with the people creating animation’s next hits too.
What it means for brands
Animation reaches every generation in the same household, but not always on the same screen. Linear TV leans older, with viewers 50+ driving 36% of the top 15’s minutes, while streaming leans younger, with kids and viewers 18-34 driving roughly 70%. Streaming also delivers the volume, accounting for 58% of those shows’ minutes. And the same show can deliver a very different audience depending on where it airs: Family Guy’s viewers 18-34 make up 20% of its linear minutes and 59% of its streaming minutes. For advertisers, that makes animation one of the most dependable ways to reach kids, parents and grandparents alike, as long as the plan spans both platforms. This International Animation Day, the hit makers deserve a toast. Their audiences keep growing up with them.
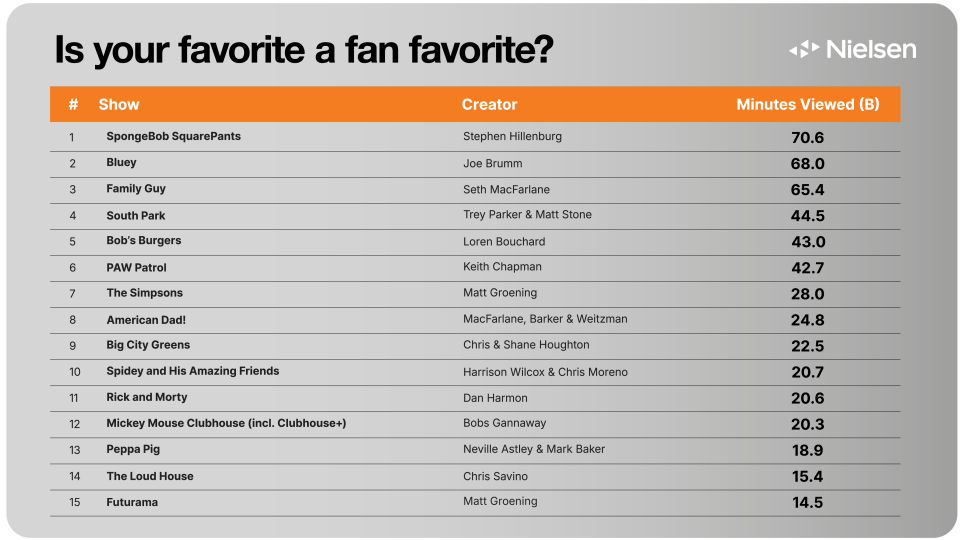
Is your favorite a fan favorite?
The 15 most-watched individual animated series of the 2025-26 TV season, linear + streaming. Minutes in billions.
Methodology. Source: Nielsen, total minutes watched, P2+ (persons 2 and older), Sept. 22, 2025 to Sept. 20, 2026. Linear refers to broadcast and cable TV, and streaming refers to titles measured on streaming platforms. Creator totals combine each creator’s shows across networks and streaming platforms, and co-creators receive full credit for every show they created.