

Nielsen Audio Measurement
What Nielsen measures, how it measures it, and why it’s the most comprehensive view of U.S. audio audiences.
Nielsen measures radio, podcast and streaming audio audiences in one system, from the largest metros to rural counties to national networks. It pairs passive electronic metering in the 48 largest markets with recall diaries everywhere else, builds every sample to represent the market, and is the only source of national network radio audience insights. No other service covers audio this broadly or connects it as easily to consumer and outcomes data. In addition, Nielsen’s long history of building proportionally accurate samples based on census data bridges the gap between big data and properly balanced panels. This delivers the most comprehensive and actionable audio insights for broadcasters, podcasters, advertisers and marketers.
250+
U.S. metros with radio ratings: 48 PPM and 200+ diary markets, plus rural counties.
Nielsen Media Knowledge Series, 2025
~ 4
hours
Time per day Americans spend with audio. Radio and podcasts get 82% of daily ad-supported audio time.
Nielsen The Record, Q1 2026
1968
The year the radio diary service first earned MRC accreditation.
Nielsen Audio Introduction
What Nielsen Audio measures
Radio
Local stations, broadcast networks, syndicated programming and HD radio, including stations’ online streams.
Podcasts
Consumers of 160+ podcasts across 9 major networks and 18 genres, plus podcast rankings and ad effectiveness.
Streaming and total audio
Use of audio streaming services and radio station apps, and all audio listening over a 24-hour period.
Geographies
Metro, DMA, county, custom trade areas and national coverage across the entire United States.
How it’s measured: local radio
Nielsen uses two methods, matched to market size. Both feed the same ratings estimates (Cume, Time Spent Listening, Average Quarter-Hour Rating and Share).
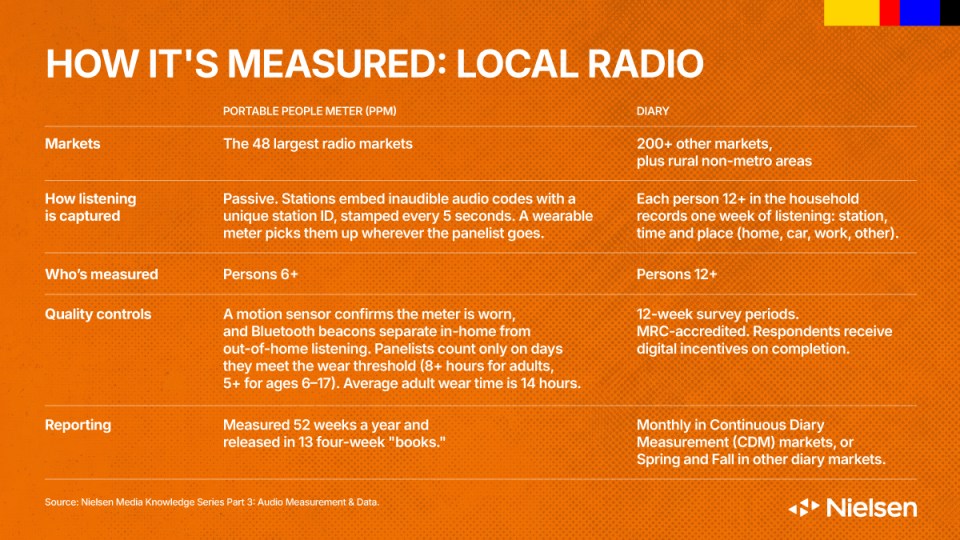
Source: Nielsen Media Knowledge Series Part 3: Audio Measurement & Data.
How the sample is built
- A random, address-based sample of about 1,000 to 6,000 people per market, depending on population.
- Recruited by landline, cell phone and in-person representatives when needed.
- Screened so that no one who works in radio or media is included.
- Weighted to match each market by geography, age, gender and ethnicity, based on US Census figures
How it’s measured: national radio
Nationwide
The network radio currency – a national database built from all PPM and diary respondents in the Spring and Fall surveys. Reports audience size and demographics for commercial and public radio networks, with estimates for 12,000+ stations.
National Regional Database
Respondent-level data for building custom trade areas across metros, DMAs and counties.
Radio County Coverage
Listening estimates for every county in the US..
Respondent Level Data (RLD)
Custom demos, geographies and dayparts, including income, household size, kids and education, plus Black and Hispanic ratings by language preference and sports program ratings. Available through TAPSCAN. ALL stations (regardless of their subscriber status) are included in RLD.
How it’s measured: podcasts and total audio
Podcast Buying Power
Shows who the podcast audience is, not just how many listen. A national Scarborough sample of 45,000+ respondents, covering 160+ podcasts from 9 networks across 18 genres, plus where, when and on what platform people listen.
Edison Research Podcast Metrics
Ranks the most popular podcasts across all platforms, from 20,000+ quarterly interviews with weekly listeners. Measures listening, not downloads.
Edison Research Share of Ear
A 24-hour diary of all audio: what people listen to, how much, when, where and on which devices.
Podcast Brand Lift
Measures the effect of podcast sponsorships and host-read ads on brand metrics.
Why it’s the most comprehensive
Coverage no one else matches.
Every measured US metro, rural counties, national networks and podcasts, in one system with one set of estimates. Nielsen reports all radio listening in every market, regardless of individual station subscriber status. This allows buyers to see radio’s full audience even if certain stations do not subscribe to receive their local market ratings.
Samples built to represent everyone.
Census-based samples are weighted by ethnicity as well as age, gender and geography, and designed to reach the hardest-to-measure groups. Black and Hispanic ratings are available by language preference. Big data is everywhere, but it doesn’t always reflect the broader population. Nielsen bridges the gap between high-volume big data and our representative samples, giving advertisers the most useful information.
Passive measurement where it matters most.
In the 48 largest markets, PPM captures listening that people may not remember to write down. Because 45% of PPM listening occasions run under 5 minutes, Nielsen lowered the qualifier to 3 minutes in January 2025. That raised measured average audience by 24% on average and credits more of the listening around ad breaks.
Independent and accredited.
MRC accreditation for the diary service dates to 1968. Nielsen measures listening in PPM markets regardless of whether a station subscribes.
Always improving.
A hybrid digital and panel approach, including the mSurvey, is used in diary markets to keep samples representative as survey responses become more and more challenging. The next steps for evolving the diary include testing new low-burden digital surveys and responsive digital designs for portions of the sample. Work is underway now.
Connected to outcomes.
A hybrid digital and panel approach, including the mSurvey, is used in diary markets to keep samples representative as survey responses become more and more challenging. The next steps for evolving the diary include testing new low-burden digital surveys and responsive digital designs for portions of the sample. Work is underway now.
Key terms
Cume
The total number of different people who tune in to a station during a daypart.
Time Spent Listening (TSL)
How long the average listener stays with a station during a daypart.
Average Quarter-Hour (AQH)
The average number of people listening in a 15-minute period, roughly the number who hear each ad. In PPM markets, listening counts at 3+ minutes.
Rating
A station’s audience as a percentage of the market’s total population.
Share
A station’s audience as a percentage of everyone listening to radio.
Additional resources
Audio reports
• Network Audio Today Report
• Black Audio Today Report
• Podcast Today Report
Audio resources
• Modernizing PPM Measurement (2025)
• Populations & Rankings
• Survey Schedules
• Delivery Schedules