Over-the-air (OTA) TV—the programming that we all have access to even if we don’t have a cable or satellite programming subscription—is becoming a big thing again. In fact, it’s one of the best things to happen to cord cutters and cord shavers, as it offers them free TV through a digital antenna. Even better, with the shift to digital broadcasting a decade ago, they’re getting even more channels for free—and in great HD quality. Because of our comprehensive panel approach, our data is inclusive of all household types, including OTA, which allowed us to conduct deep insights and analysis in this important growing segment. So what do we know about OTA households? We recently dived into the data to find out more about them—particularly, how many there are, what they look like and how they consume media.
THERE’S A LOT OF THEM
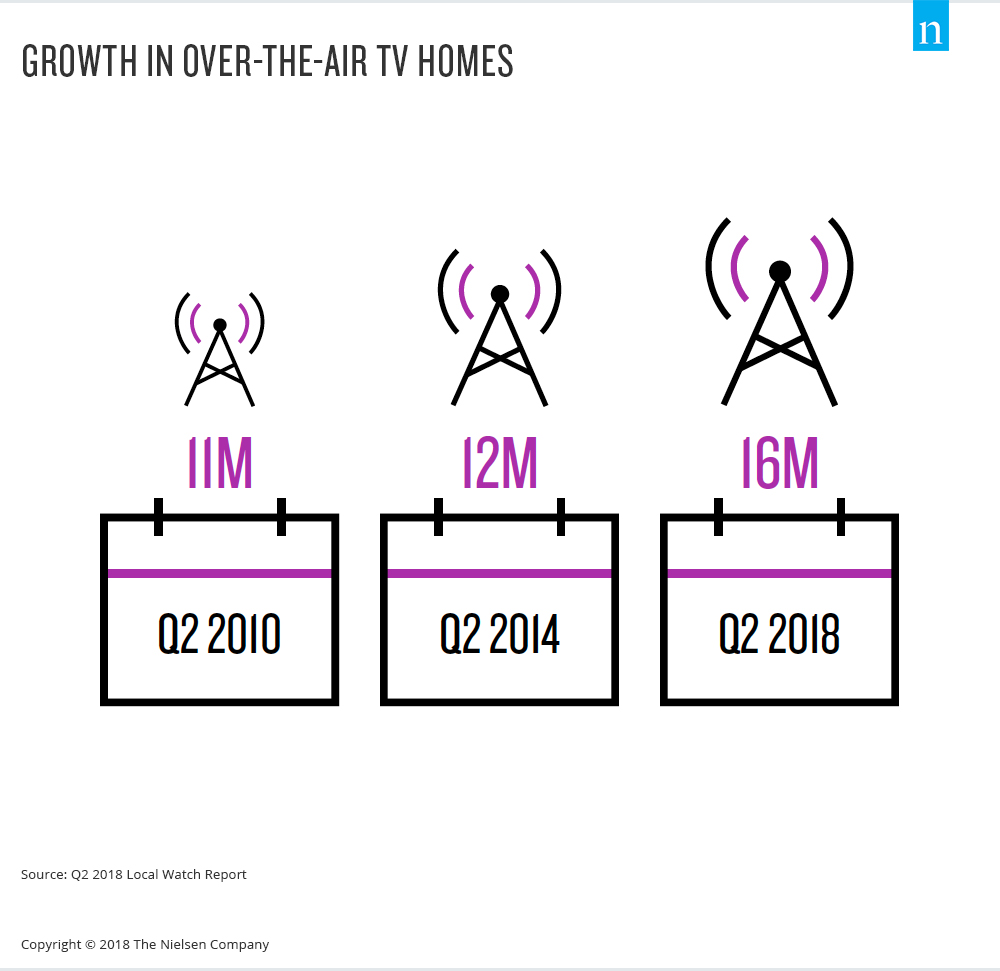
According to May 2018 Nielsen population estimates, as detailed in our latest Local Watch report, there are over 16 million OTA homes in the U.S. That comes out to just over 14% of households. Back in 2010, that number was much lower—5 million less, to be exact. That’s an increase of almost 50% over eight years. And as an increasing number of consumers consider a more à-la-carte approach to their TV sources, there is opportunity for this segment to continue growing.

THEY’RE NOT ALL ALIKE
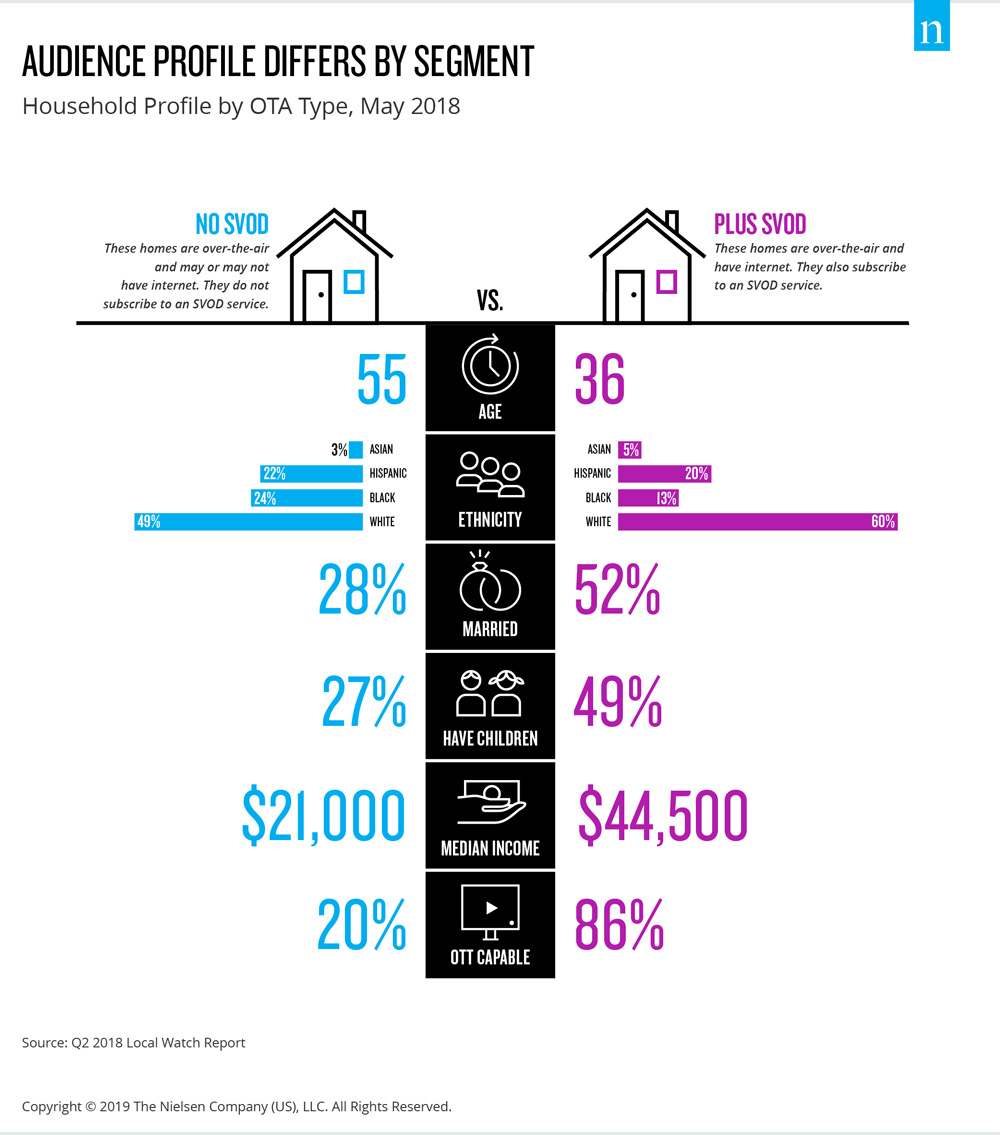
While many of us may equate OTA TV with “rabbit ears” and a physical dial on the TV set, today’s, OTA homes aren’t what they used to be—just like the technology isn’t the same. Today, these homes are a mix of audience groups that consume TV content in different ways. Some are standard OTA homes that access programming with a digital antenna, but most pair their OTA line-up with streaming services. As of May 2018, 41% of OTA homes are traditional, without a streaming service provider. That means the majority subscribe to a streaming service (59%). Nielsen data paints a vivid picture of these two very different groups, revealing some surprising gaps in age, ethnicity and income. Suffice to say, the only thing these households have in common is the absence of cable cords and satellite dishes.
To further muddy the waters, a third type of OTA home subscribes to a virtual video multichannel programming distributor (vMVPD), commonly known as a “skinny bundle,” which allows them to stream cable programs. This group falls directly into the streaming service segment (Plus SVOD) that makes up 59% of OTA homes. As of May 2018, it accounted for 8% of OTA, or 1.3 million homes.

A BRIGHT SPOT FOR BROADCAST
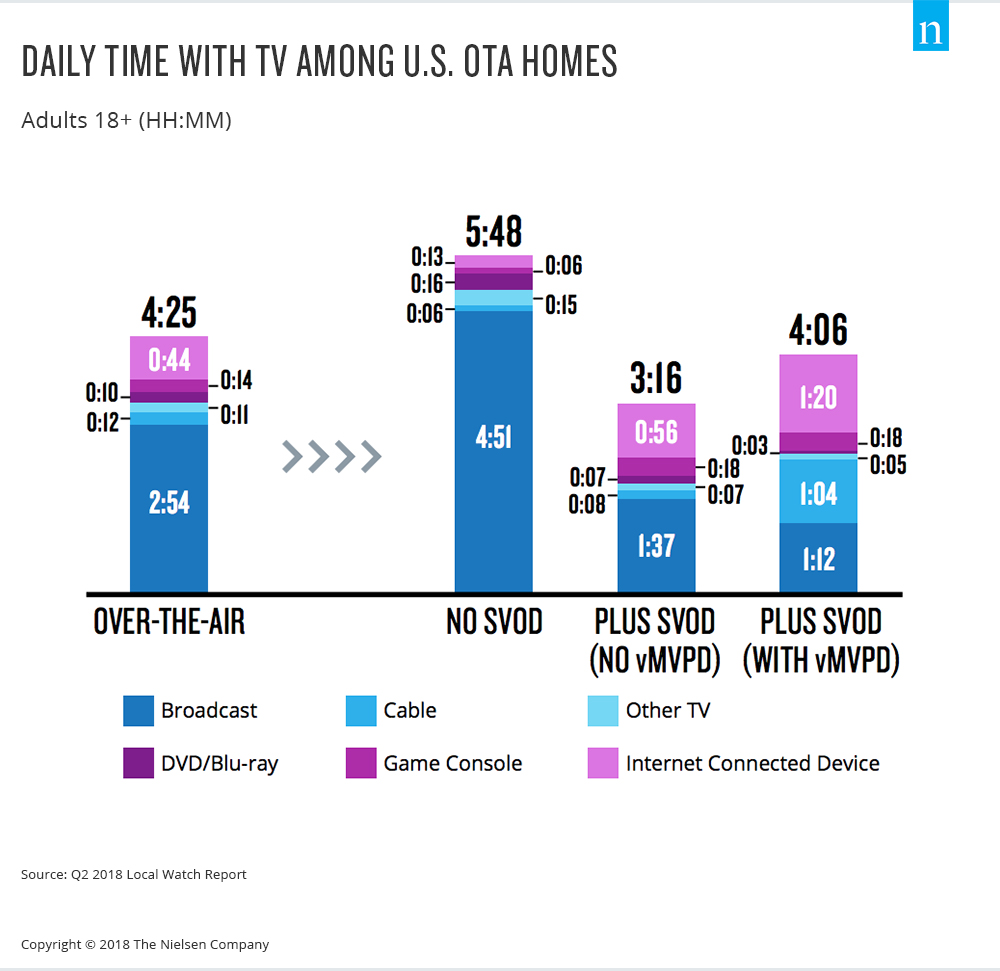
Three hours each day comes out to roughly 1,100 hours per year, which represents the amount of time the average adult in an OTA home spends watching broadcast content on TV. While that’s a big number, it can be deceiving. Behind the scenes, three very different audience segments (no SVOD; OTA + SVOD; OTA + SVOD w/vMVPD) make up that number. So which segment is watching the most content? Those without SVOD spend a whopping 4 hours and 51 minutes with broadcast TV each day. But, the story is different for the others. Higher fragmentation driven by internet-connected device usage brings broadcast viewing down, but SVOD homes with and without a vMVPD still clock over an hour per day. Cable viewing picks up steam with vMVPD access, but still lags behind broadcast viewing. Regardless of OTA home type, broadcast TV is a daily go-to source for content on the TV screen.


