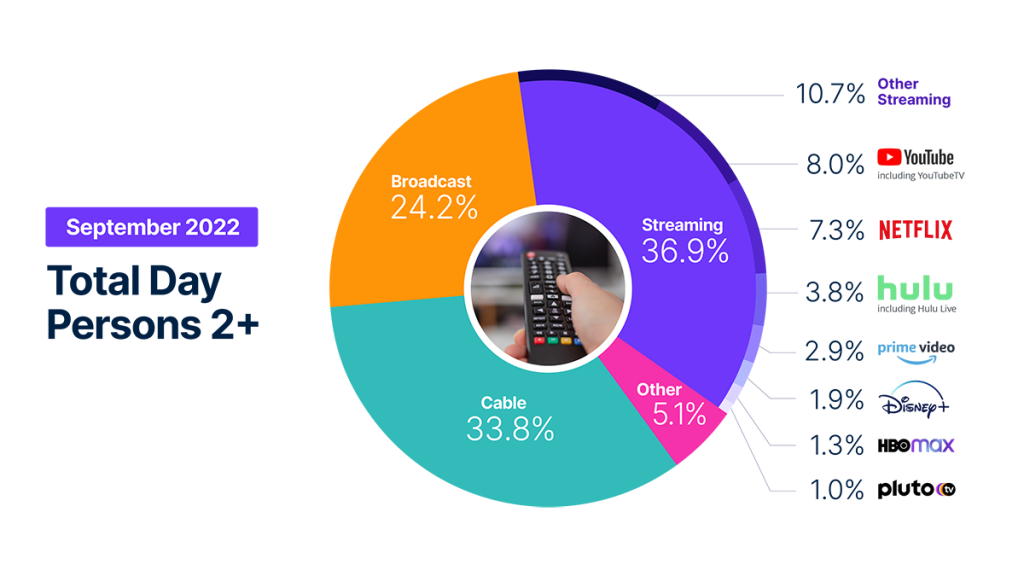
Broadcast TV viewing increases 12.4%; streaming hits new high-water mark at 36.9%* of TV usage
The kickoff of the fall TV season and the return of football provided audiences with an abundance of new content in September, fueling a 2.4% rise in total TV viewing. The arrival of new broadcast programming provided the traditional lift that we’ve seen historically, but the 12.4% increase in volume from August wasn’t enough to alter the forward trajectory of streaming usage, as streaming services captured 36.9% of total TV usage*.
Alongside the whopping, but perhaps not totally unexpected, 222% increase in sports viewing on broadcast channels, audiences continued to over-indulge on streaming content, resulting in yet another monthly high-water mark. Audiences also continue to expand their choice of streaming service, with YouTube hitting a new platform-best streaming record, claiming 8% of TV viewing and equaling Netflix’s July record high, Hulu securing its own record of 3.7%, and Pluto TV capturing 1% of total TV, enabling it to be showcased outside of the “other streaming” category. HBO Max also gained 9.9% in volume thanks to House of the Dragon and Game of Thrones, pushing its share of TV to 1.3%.
In several cases, increases in volume did not affect total TV share. For example, Amazon Prime Video usage increased 3.9% in September on the strength of The Lord of the Rings: Rings of Power and specific Thursday Night Football games, but the platform’s share of total TV remained flat at 2.9%. Similarly, Disney+ saw a 2.4% increase in volume, yet its share of total TV stayed at 1.9%.
Broadcast recorded the largest month-over-month gain, driven by the sports genre, which accounted for 25.1% of broadcast viewing. That said, broadcast’s 24.2% share in September was 7.1% lower than it was a year ago. Cable also benefited from a 40% bump in sports viewing, but the 0.4% rise in usage wasn’t enough to move cable’s share of total TV. In fact, with the other categories gaining share in the month, cable dropped 0.7 share points to finish with 33.8% of total TV, its lowest share ever reported by The Gauge. Cable viewing was 9.3% lower in September compared with a year ago.
The return of football was the true spark in September, as it provided new content across broadcast, cable and streaming. But even without sports, streaming—in all of its forms—continues to gain adoption, and it benefits from the emphasis that pure-play streamers and media companies alike are placing on it.
Note
*This month’s data reflects a methodology change to present total TV viewing behavior more consistently. Beginning with the September 2022 edition of The Gauge, viewing data in the streaming category is calculated on a live + 7 days basis. Previously, streaming data was calculated on a live-only basis. This change affected the streaming and other categories (and represented a shift of 1.0 share points from “other” to “streaming”), as well as to the services that include “linear streaming” (e.g., YouTubeTV and Hulu Live). Linear streaming on MVPDs and vMVPDs represented 5.4% of total television usage and 14.5% of streaming in September. Broadcast and cable content viewed through linear streaming apps also credits its respective category.
Methodology and frequently asked questions
The Gauge provides a monthly macroanalysis of how consumers are accessing content across key television delivery platforms, including broadcast, streaming, cable and other sources. It also includes a breakdown of the major, individual streaming distributors. The chart itself shows the share by category and of total television usage by individual streaming distributors.
How is ‘The Gauge’ created?
The data for The Gauge is derived from two separately weighted panels and combined to create the graphic. Nielsen’s streaming data is derived from a subset of Streaming Meter-enabled TV households within the National TV panel. The linear TV sources (broadcast and cable), as well as total usage are based on viewing from Nielsen’s overall TV panel.
All the data is based on a time period for each viewing source. The data, representing a broadcast month, includes a combination of Live+7 viewing for the reporting interval (Note: Live+7 includes live television viewing plus viewing up to seven days later for linear content).
What is included in “Other”?
Within The Gauge, “other” includes all other TV. This primarily includes all other tuning (unmeasured sources), unmeasured video on demand (VOD), streaming through a cable set top box, gaming and other device (DVD playback) use. Because streaming via cable set top boxes does not credit respective streaming distributors, these are included in the “other” category. Crediting individual streaming distributors from cable set top boxes is something Nielsen continues to pursue as we enhance our Streaming Meter technology.
What is included in “other streaming”?
Streaming platforms listed as “other streaming” includes any high-bandwidth video streaming on television that is not individually broken out.
Where does linear streaming contribute?
Linear streaming (as defined by the aggregation of viewing to vMVPD/MVPD apps) are included in the streaming category and represented 5.4% of total television in September 2022. Broadcast and cable content viewed through these apps also credits to its respective category.
Do you include live streaming on Hulu and YouTube?
Yes, Hulu includes viewing on Hulu Live and YouTube includes viewing on YouTube TV.
Encoded Live TV, aka encoded linear streaming, is included in both the broadcast and cable groups (linear TV) as well as under streaming and other streaming e.g., Hulu Live, YouTube TV, Other Streaming MVPD/vMVPD apps. (Note: MVPD, or multichannel video programming distributor, is a service that provides multiple television channels. vMVPDs are distributors that aggregate linear (TV) content licensed from major programming networks and packaged together in a standalone subscription format and accessible on devices with a broadband connection.)