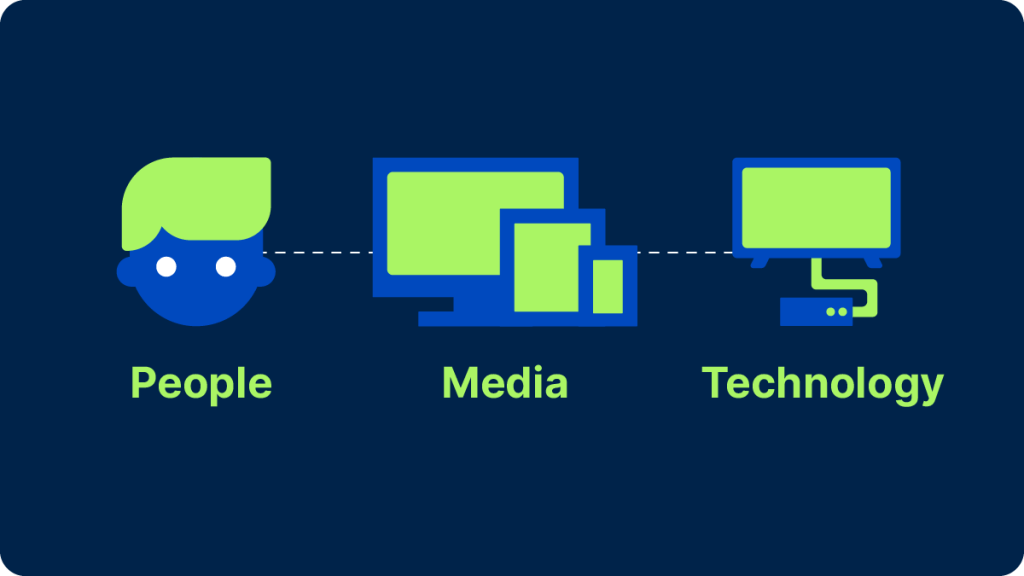
To measure TV audiences, you need three key ingredients: a data source (a combination of panel and big data capable of properly representing viewing audiences); technology (to capture and correctly identify viewing data); and metrics (to make sense of that viewing data for all stakeholders).
This article focuses on the last two ingredients: What specific technology is the industry using to capture viewing data, and what metrics are media companies and advertisers using to conduct their business?
But first, let’s review a few key tenets of TV measurement.
Tenets of modern TV measurement
Person-level measurement:
Detecting what people are watching and who is watching are two separate things. Brands want to reach individual consumers, not households, and media companies want to personalize their offerings to individuals, too. While big data1 collection is deeply automated, it has drawbacks, including failing to register who’s in front of the screen. That’s one of the main reasons why combining big data with data from people-based panels has become such an industry priority.2
Event-based media:
In the pure linear-TV world, audiences used to tune in based on an established schedule. Media companies filled programming schedules and sold advertising spots solely based on the audience that was expected to show up during that time slot. Today, audiences are watching on their own time, and, with the rise of both on-demand streaming and scheduled free, ad-supported streaming (FAST) channels, the notion of schedule-based viewing is evolving.
Invisible technology:
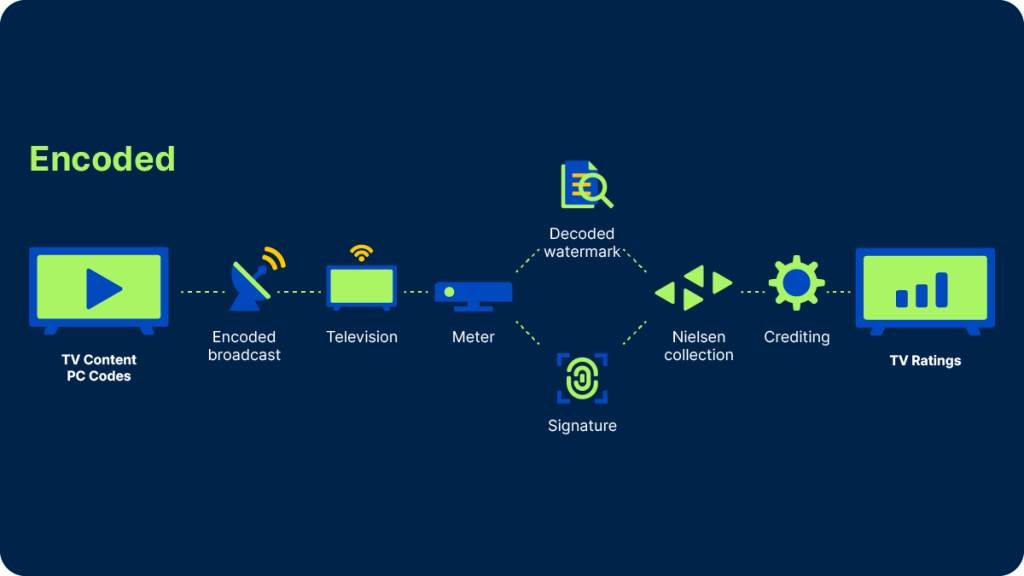
At Nielsen, we developed technology to encode inaudible watermarks3 into a TV broadcaster’s audio signal and decode them in our panel homes, whether live or time-shifted. And for cases where watermarks couldn’t be detected, we included software in our meters capable of composing audio ‘fingerprints’ on the fly for comparison against a reference library. We’ve enhanced those technologies over time but they still form the backbone of our metering infrastructure today. In fact, we’ve upgraded both watermarking and fingerprinting capabilities to increase ad detection frequency and start reporting on subminute events.
Counting every viewer
To assign viewing to the right person, we currently use within our panel what we call a ‘people meter,’ which can take the form of a set-top device with a remote control or a wearable device, like a clip, pendant or wristband. Our first people meter dates back to 1987, and the technology is crucial in an industry where the ultimate focus is on the individual, not the household.
The benefit of having high-quality individual viewer data is two-fold: It provides demographic audience estimates4 and it allows us to estimate co-viewing in big datasets.
Two different audience data uses
Now that we’ve examined some of the key technologies used to capture the what and who of TV viewing, what do we do with it?
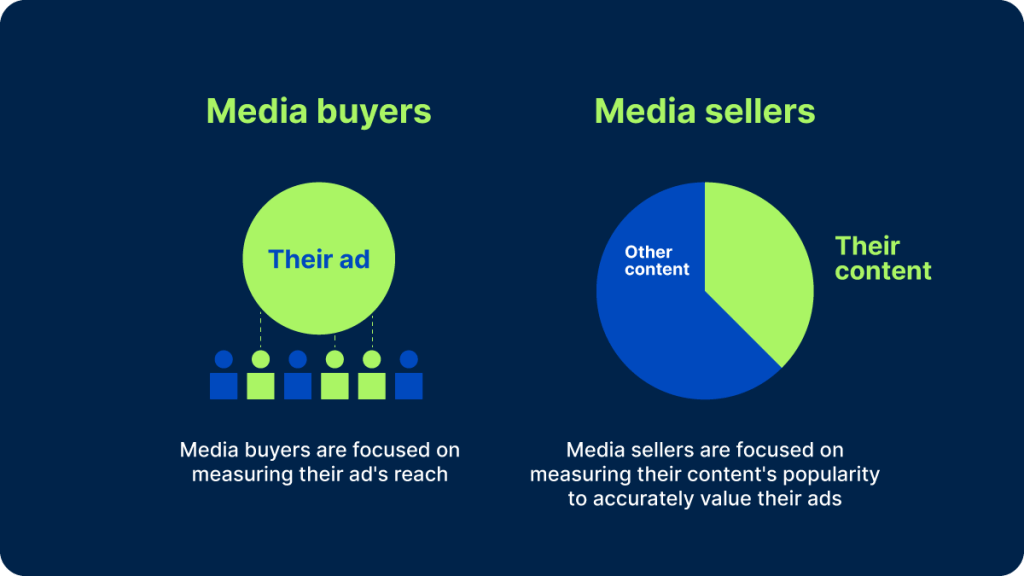
There are two main users for that data: media buyers (i.e. agencies and advertisers) and media sellers (i.e. publishers and platforms), and each constituency looks at TV measurement from a slightly different angle.
For media companies, the most iconic measure of a TV show’s success — and how the inventory should be priced — has been the rating. It’s synonymous with our company name and a big part of its appeal comes from its simplicity: It’s just the percentage of the (TV-owning) population that watched a particular program or commercial. There are many variations: A rating may be based on live viewing only, live + same day playback, live + 3 days, live + 7 days, or even live + 35 days. And there are ratings for households as well as for specific demographic groups.
Many of these figures are published daily by the trade press, and we publish a few topline rankings ourselves every week. With more and more people watching TV content in streaming-first homes,5 we are starting to size up success in terms of impressions to account for all possible viewing platforms.6
For brands and their media agencies, the objective is to reach a set number of viewers within a particular demographic profile, with the right creative and the right frequency to stimulate interest for their product or service. Frequency control isn’t always easy to achieve, especially when a campaign runs across multiple platforms, and TV advertisers often end up buying gross rating points (GRPs) where reach and frequency are multiplied but frequency remains largely uncontrolled for individual viewers. Ultimately though, advertisers are most concerned with ad impressions. Programs, networks and platforms are vehicles to reach their target audiences as efficiently as possible.
While media companies have an incentive to define TV viewership broadly, advertisers have an incentive to define it narrowly and only pay for impressions that hit their targets. So, how do they meet in the middle?
Current and future measurement state
To transact today, media buyers and sellers rely on average commercial minute ratings that measure the average viewership of all of the commercials that air within a program. The most widely used of those metrics is called ‘C3,’ and it takes into account all live + 3 days’ worth of a program’s playback, typically for all adults 18-49 (viewed as a key buying group), but sometimes for other key demos as well. A similar metric (C7) can be used when 7 days’ worth of playback is deemed to be preferable.
Two important developments are underway. One relates to the source of the data and the other to the way those metrics themselves are calculated.
A new data source:
The industry is in the process of transitioning to a panel + big data measurement paradigm where the scale of modern big datasets is brought to bear to increase program coverage, and panel data is used to fill the gaps and model demographic behavior. In September of 2023, Nielsen introduced C3 and C7 ratings with Big Data for buying and selling. We’ll continue to produce this alongside our panel-only measurement.
A new way to measure commercials:
Nielsen meters have been updated to detect watermark codes at the subminute level. This means we can start crediting individual commercials with their own rating instead, even if they last 15 seconds or less. Ultimately, this will help the industry transact with more flexibility and granularity.
These changes will require careful planning and continued testing, but they hold the promise of bringing TV measurement closer to the way that digital advertising is measured today, with media companies able to place a premium on effective ad package positions and advertisers able to measure the performance of individual commercials—and ultimately better manage their media spend.
Nielsen’s Need to Know reviews the fundamentals of audience measurement and demystifies the media industry’s hottest topics.
Notes
1 I.e., Return path data (RPD) from set-top boxes and automatic content recognition (ACR) data from smart TVs. See Need to know – the pros and cons of big data in audience measurement for more details.
2 For more details on the promises of panel + big data measurement, read Need to know – what’s a panel, and why does it matter?
3 Watermarks are source codes that are embedded into content
4 TV News Check: Nielsen remains the currency of the TV realm (May 10, 2023)
5 Nielsen: Connectivity is driving how Americans are engaging with TV (2023)
6 Broadcasting & Cable: Impressions 2.0: the great equalizer (Feb 8, 2022)