Make no mistake about it, the Super Bowl is the biggest TV event of the year—by a massive margin. Last year’s game attracted more than 101 million viewers, cementing viewership of 100 million-plus for 11 of the past 12 years. For context, the most watched new primetime program in the fall 2022 TV season attracted a viewership of 5.8 million1.
The widespread appeal of the NFL content, coupled with the growing variety of ways in which audiences engage with it, illuminates the shift to streaming that is starting to take place in sports programming—a shift that we’ve tracked across other program genres in the nearly two years since we launched The Gauge. In December 2022, for example, streaming had grown to account for more than 38% of total TV usage.
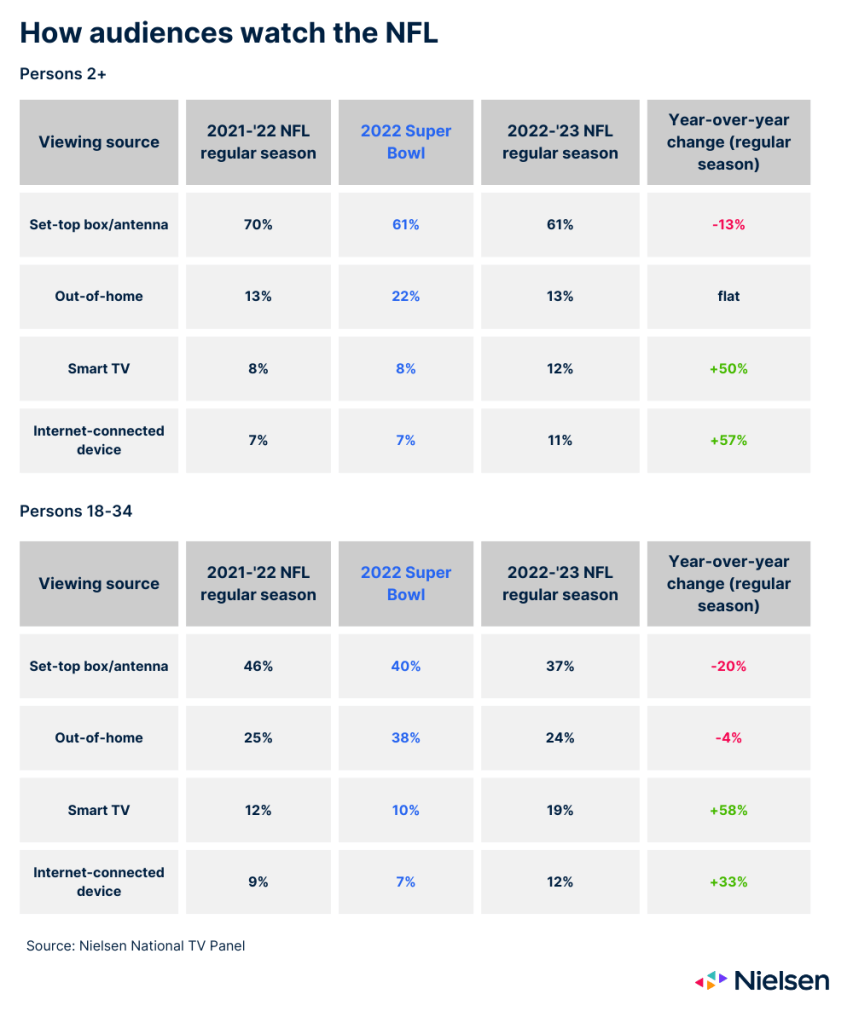
Sports programming remains a fixture within the broadcast television world, yet rights deals are increasingly moving lucrative programming—including the NFL’s Thursday Night Football and all matches in the the upcoming MLS season—to streaming services. But on Super Bowl Sunday, the TV industry’s biggest day of the year, audience access isn’t limited to a single platform or technology. In fact, the magnitude of the event dictates that it’s available to audiences regardless of how they typically watch TV. Outside of the Super Bowl, however, we can see the tides are shifting, as audiences are steadily switching to smart TVs and internet-connected devices for regular season games. This will likely accelerate next season when the NFL Sunday Ticket hits YouTube TV.

Despite the overall appeal of NFL content, the hometowns of this year’s Super Bowl contenders have significantly different levels of interest in the league. In the 2022-23 season, Kansas City was one of the most engaged markets for the NFL, posting an average rating of 42.12, edged out just slightly by Buffalo, with an average rating of 45.9. Comparatively, the average rating in Philadelphia was 25.3, placing the City of Brotherly Love at No. 9 among the league’s 32 teams.
The viewership in these two league stronghold cities tracks with the interest levels of the people who live there. According to Nielsen Scarborough, just over 44%3 of Philadelphia’s residents say they are either very or somewhat interested in the NFL, with 51% saying that they watch, stream and listen to Eagles games. And when it comes to the Super Bowl, only 5.3% say they stream it.
A bit west, just less than 70% of Kansas City’s residents say they are either very or somewhat interested in the NFL, with more than 72% saying that they watch, stream and listen to Chiefs games. And when it comes to the Super Bowl, 8.5% say they stream it.
Viewing behaviors and levels of fandom aside, NFL content, particularly the Super Bowl is among the top-performing programming on TV. And as sports begin to transition to new platforms and services, the audience numbers—across devices and platforms—serve as evidence the viewership will follow.
Notes
- Live + same-day viewership; Nielsen national TV panel data via NPOWER
- Nielsen national TV panel data via NPOWER
- Nielsen Scarborough, 2022 release 2


