From smartphones to tablets and even the latest generation gaming consoles, today’s technology is changing rapidly. According to Nielsen’s third-quarter Total Audience Report—formerly the Cross-Platform Report—this fragmentation doesn’t apply just to technology; consumers’ viewing habits are following suit.
The recent proliferation of new devices allows consumers to connect with content anytime and anywhere. What used to be a schedule to watch programming now seems like little more than a suggestion, as viewers can choose to watch live linear programming, video on-demand, or through subscription services and apps, among other ways to tune in.
“Content is still king, but consumers are shaping their own content-discovery experience, and the evolving media landscape has not lessened consumer demand for quality, professionally-produced content. What has changed is the number and reliability of new media available to viewers,” said Dounia Turrill, senior vice president, insights, Nielsen.
All Americans spent a little more than 141 hours a month connecting with traditional television in third-quarter 2014. During the same period, the overall population also saw over an hour increase in time spent watching time-shifted content and a four-hour increase watching video on the Internet.
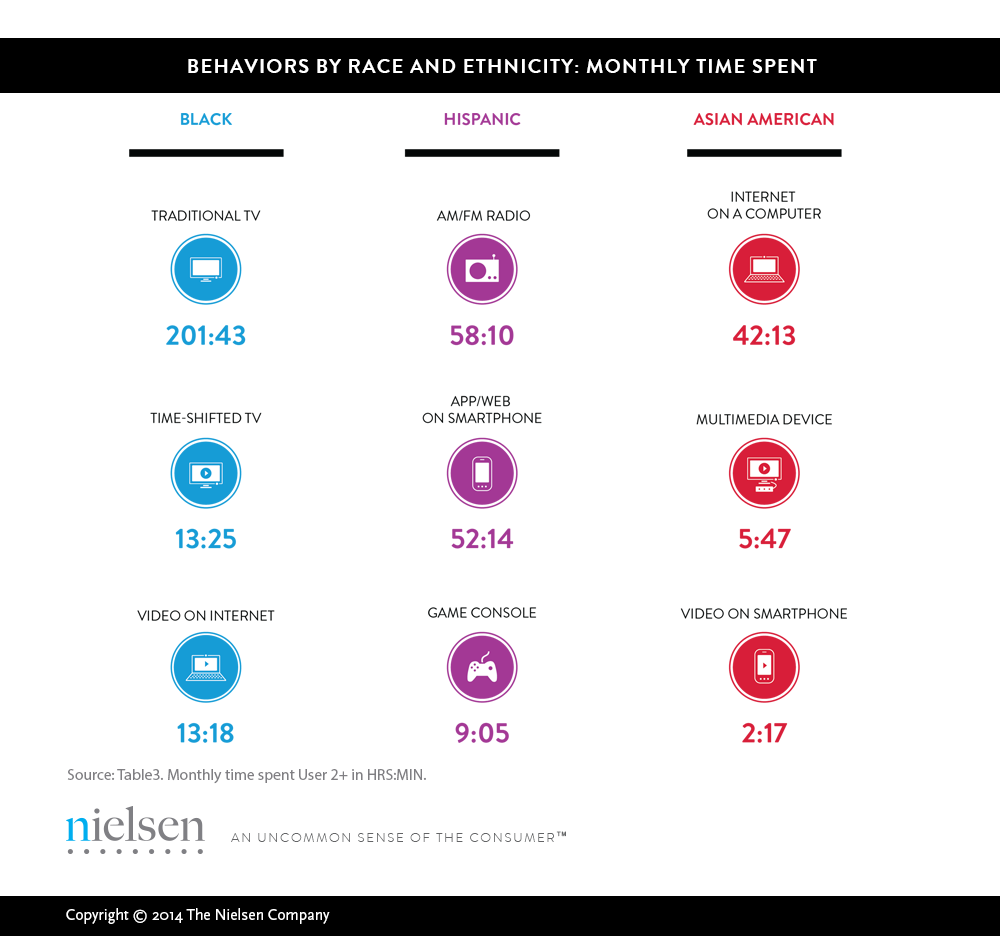
But not all consumers are watching the same way. Among the different race/ethnicities featured in the report, content consumption varies widely.
In the third-quarter of 2014, Black viewers’ monthly time spent watching traditional television was the highest of any group, with these consumers logging an average of more than 201 hours per month. On the other hand, Hispanic and Asian American viewers under index in regard to monthly time spent watching traditional TV, with about 117 and 82 hours, respectively.
In some instances, a demographic’s adoption of a platform or device may affect the group’s nontraditional viewing habits.
For instance, while Asian Americans’ monthly time spent watching traditional television in third-quarter 2014 dipped about 6% from third-quarter 2013—or nearly five hours overall—this group’s time spent watching video on the Internet has seen a 17% uptick over that same time. Perhaps not coincidentally, tablet penetration among Asian Americans has also risen 17% percentage points during the period.

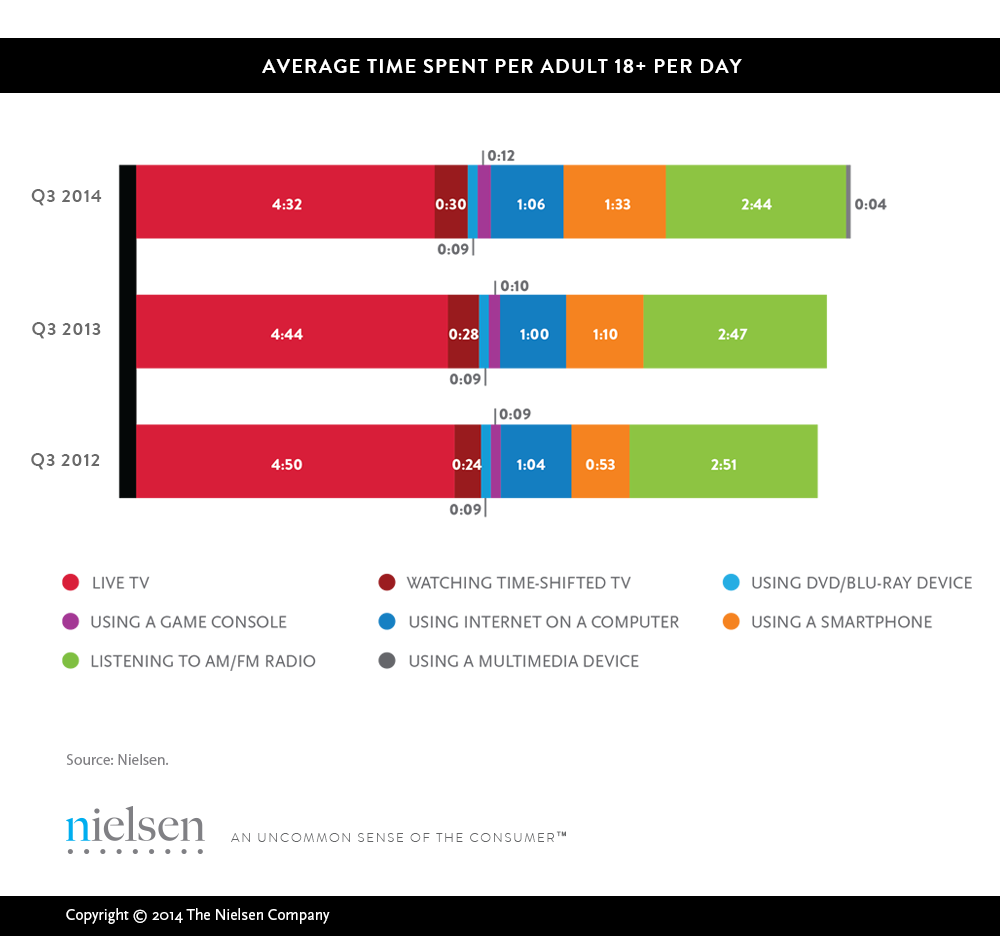
Overall, American’s average daily time spent watching live TV decreased 12 minutes from 4 hours and 44 minutes in third-quarter 2013 to 4 hours and 32 minutes in third-quarter 2014. Conversely, consumer’s daily time spent using a smartphone increased 23 minutes, from 1 hour and 10 minutes to 1 hour and 33 minutes per day. Timeshifting content (using a DVR or video-on-demand technology) continues to resonate with consumers, and while still a small part of overall usage across platforms and devices, daily time spent using a multimedia device continues to climb.

Note: Data used in this report is inclusive of multicultural audiences. Hispanic consumer audiences comprised both English- and Spanish-speaking representative populations.


