As content monetization remains a top priority across the streaming landscape, distribution strategies are shifting to cast much bigger nets than they have in the past—a trend we first noted in our 2023 State of Play Report. Case in point, Nielsen’s U.S. streaming top 10 list for the week of Sept. 18, 2023, included five different acquired titles1 that are available to stream on multiple services, with one title available on three platforms.
Combined, American audiences streamed just over 4.2 billion minutes of these five shows in that single week. That’s more than 72% of the time that audiences spent watching the top 10 original programs during the same week.
The availability of content in more than one place reflects a shift in distribution strategies—one that has been taking shape throughout this year. During the week of Jan. 2, 2023, for example, none of the top 10 acquired programs were available on multiple platforms. A week later, New Amsterdam hit the top 10 list after debuting on Netflix and Peacock. At the start of fall, almost half of the top 10 acquired titles were available on multiple services.
The pivot to wider distribution strategies is evident across the media landscape, and it reflects a number of factors, none of which are universally applicable.
- Free, ad-supported TV (FAST) channels are on the rise, and publishers want to get content where audiences are. In September, the three FAST channels independently measured in the Gauge accounted for 3.2% of total TV.
- The cost of producing a new show doesn’t always pay off. Citadel, for example, had a reported budget of $200 million-$300 million and failed to appear on Nielsen’s top 10 list of most-watched streaming content.
- The summer strikes created a lack of new content this fall. Yellowstone, a Paramount original, has found a new audience on CBS, and the ratings have been strong enough for the network to start running season 2.
- Perspectives about content licensing are changing. While likely a financially motivated move, Warner Bros. Discovery made headlines earlier this year when it licensed a number of HBO titles to Netflix. Incidentally, two of these titles (Band of Brothers, The Pacific) landed on Nielsen’s top 10 list the week of Sept. 18.
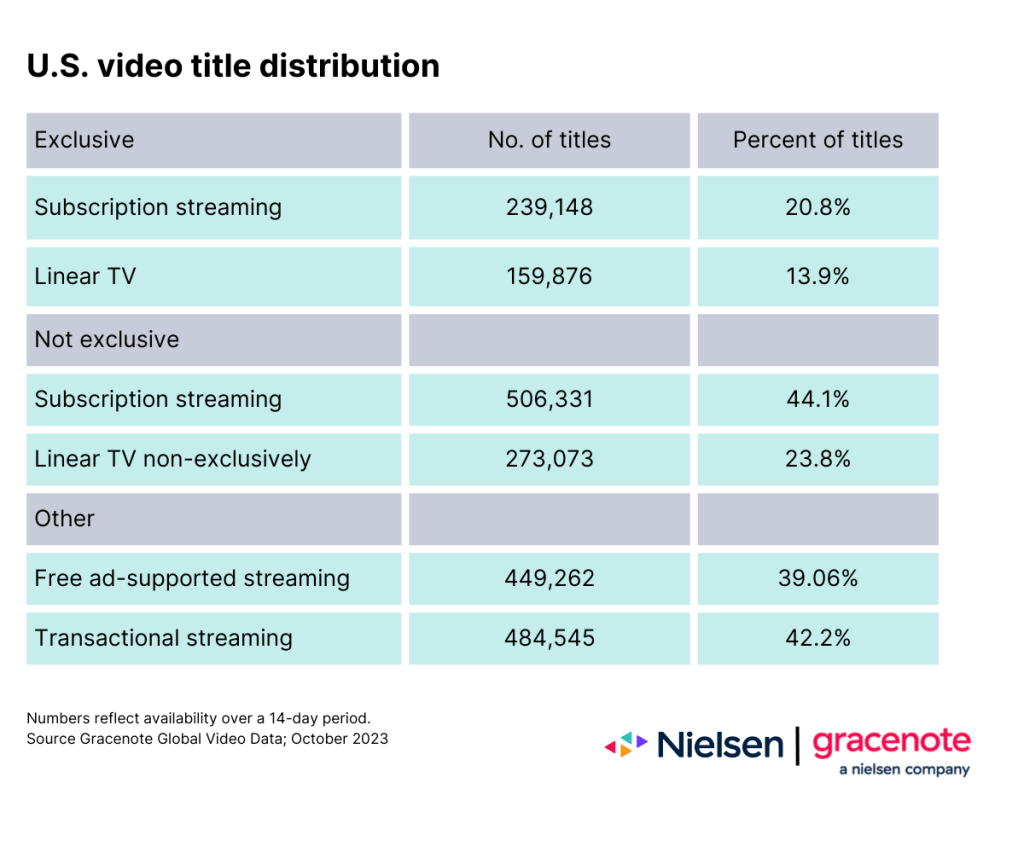
In looking at the widening range of content available to U.S. audiences, the large majority is not exclusive to a single channel or source. TV viewers had more than 1.1 million unique video titles2 to choose from as of October 2023, and only 34.7% were exclusive to either a streaming service or a linear channel.
Among the examples of expanded distribution, none stand out like Suits, which recently held the No. 1 spot on Nielsen’s top 10 list for a record 12 consecutive weeks (Ozark previously held the record with 11 weeks at No. 1). During those 12 weeks, viewers watched more than 36.8 billion minutes of the legal dramedy—enough to spark the show’s creator to start developing a follow-up program.
And it’s not just owners of scripted content that are broadening the reach of their content. Helped by the lack of new content this fall and football’s huge fan base, for example, the NFL has amplified the presence of this year’s Monday Night Football (MNF) games by airing them across three different networks.
While the other two days that feature one game (Sunday night and Thursday night) are only being shown on one telecast each week, the NFL is doubling down on Mondays: Weeks 2 and 3 featured doubleheaders on ABC and ESPN, and all other Monday games will air on ABC, ESPN and ESPN2. Last year, there was only one doubleheader, and only the first three games were on ABC. In total, weeks 1-7 this year drew a total audience of more than 138 million viewers, compared with just under 112 million from games 1-7 last year.
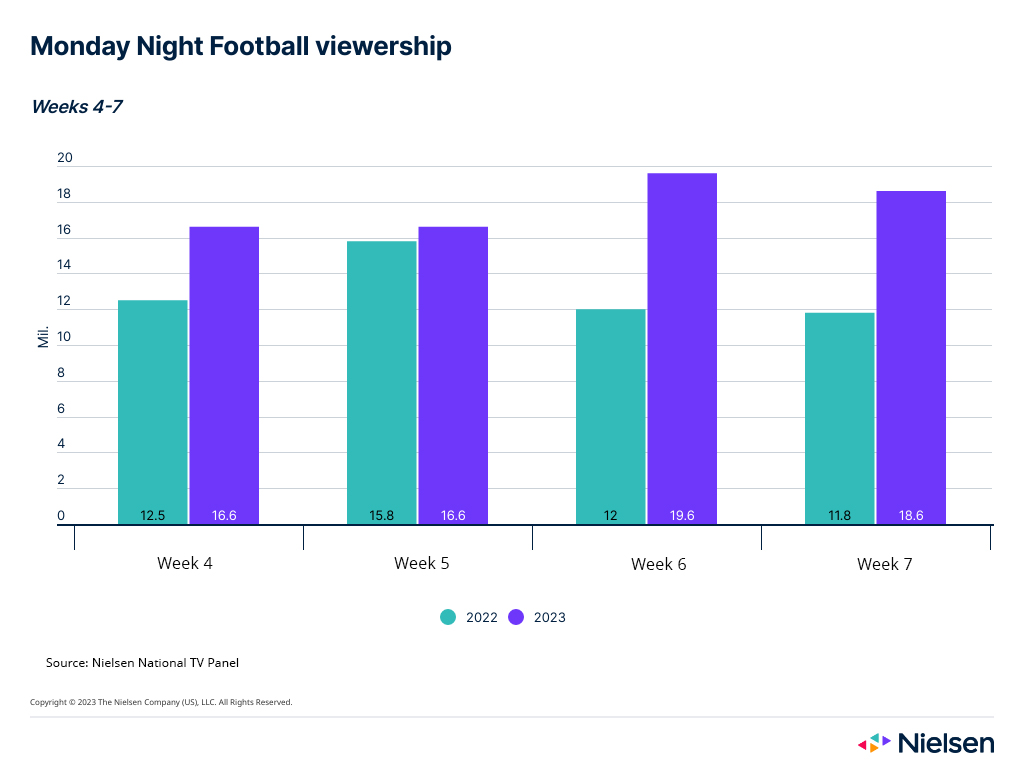
The viewership data for this year’s MNF games highlights that making content available in multiple places drives higher viewership—especially when not all audiences have access to the same channels and platforms. The strategy is also broadening the demographics of who’s watching, along with some help from Taylor Swift. In aggregate, this year’s first seven Monday games have attracted more than 10 million additional female viewers.
In years past, when there were fewer places to find content—and fewer options to spend money on—content owners and distributors were able to attract larger audiences to a single source.
Today, audiences in the U.S. have more than 32,200 linear channels and 89 streaming video sources3 to choose from, and viewers are exploring them all. This reality presents a much different scenario than when audiences spent most of their TV time with aggregated, provider-chosen options within a single environment.
While the dispersal of viewing is unique from a historical perspective, audience measurement data provides evidence that reach and engagement increase when content is available across channels—and distribution trends are following suit. As the industry begins to look ahead to next year’s content and advertising plans, taking these changes into consideration could help, especially in a year when new content will likely be limited.
For publishers, finding new opportunities to license content can grow buzz and viewership around existing content. Understanding these new patterns for audience engagement will be critical for advertisers and agencies when considering where to reach viewers in the year ahead—especially as they navigate the quickly evolving FAST landscape. But while program-level engagement highlights broad viewing trends, advertisers and agencies should explore channel-specific viewership for the insight they need as they plan and execute their ad buying strategies.
Looking for channel-specific viewership? Check out Nielsen’s Streaming Content Ratings for show-specific TV viewing data.
Sources
1Acquired titles are those that have been licensed from other content owners after first airing somewhere elsewhere first. For example, audiences can find S.W.A.T., a CBS original, on Hulu, Netflix and Paramount+.
2Gracenote Global Video Data
3Gracenote Global Video Data; October 2023. Each channel represents a unique source of linear programming, such as ABC and Flicks of Fury, an original channel on Pluto TV. Each streaming video source represents an individual provider, such as Netflix and Disney+.